
- Start >
- Groundwater >
- Waterlevel of upper layer >
- Inn >
- GLOCKEN D 12 >
- Chart of total period

Chart of total period GLOCKEN D 12
Groundwater levels of the total period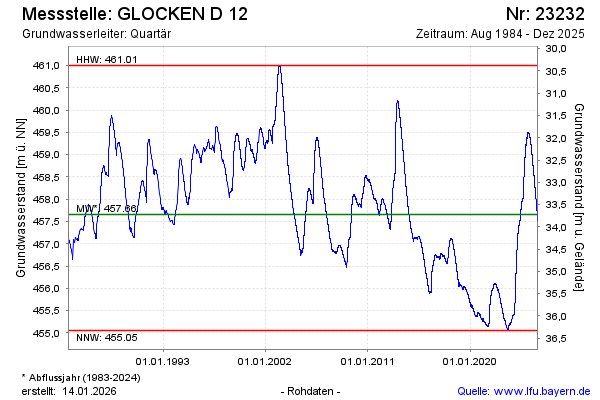
Groundwater level [m above sealevel]: 459.49
Distance to surface [m]: 31.89
Last value from 04.02.2025 12:18
Ground level [m above sealevel]: 491.38
| Date | Groundwater level [m above sealevel] |
|---|---|
| 04.02.2025 | 459.49 |
| 03.02.2025 | 459.49 |
| 02.02.2025 | 459.49 |
| 01.02.2025 | 459.48 |
| 31.01.2025 | 459.48 |
| 30.01.2025 | 459.49 |
| 29.01.2025 | 459.49 |
| 28.01.2025 | 459.50 |
© Bayerisches Landesamt für Umwelt 2025