
- Start >
- Groundwater >
- Waterlevel of upper layer >
- Isar >
- ECHING 275D >
- Chart of total period

Chart of total period ECHING 275D
Groundwater levels of the total period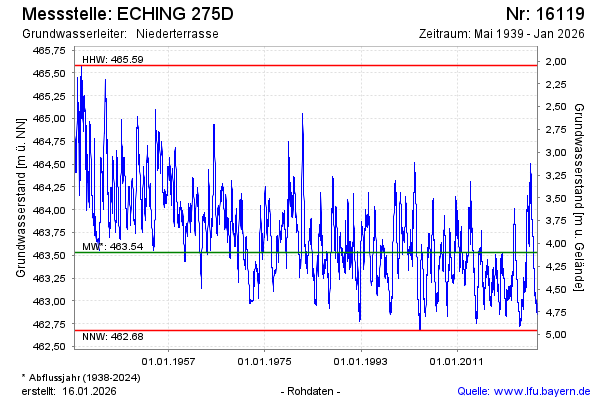
Groundwater level [m above sealevel]: 463.56
Distance to surface [m]: 4.07
Last value from 12.03.2025 09:00
Ground level [m above sealevel]: 467.63
| Date | Groundwater level [m above sealevel] |
|---|---|
| 12.03.2025 | 463.56 |
| 11.03.2025 | 463.56 |
| 10.03.2025 | 463.57 |
| 09.03.2025 | 463.57 |
| 08.03.2025 | 463.58 |
| 07.03.2025 | 463.58 |
| 06.03.2025 | 463.59 |
| 05.03.2025 | 463.59 |
© Bayerisches Landesamt für Umwelt 2025