
- Start >
- Groundwater >
- Waterlevel of upper layer >
- Obere Donau >
- EITTING Q 10 >
- Chart of total period

Chart of total period EITTING Q 10
Groundwater levels of the total period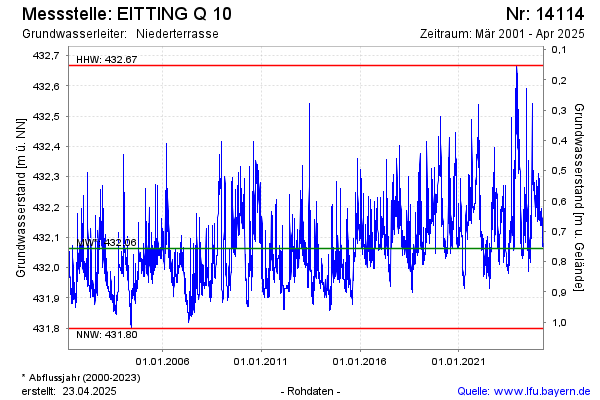
Groundwater level [m above sealevel]: 432.16
Distance to surface [m]: 0.66
Last value from 16.02.2025 09:00
Ground level [m above sealevel]: 432.82
| Date | Groundwater level [m above sealevel] |
|---|---|
| 16.02.2025 | 432.17 |
| 15.02.2025 | 432.17 |
| 14.02.2025 | 432.18 |
| 13.02.2025 | 432.19 |
| 12.02.2025 | 432.17 |
| 11.02.2025 | 432.16 |
| 10.02.2025 | 432.16 |
| 09.02.2025 | 432.16 |
© Bayerisches Landesamt für Umwelt 2025