
- Start >
- Lakes >
- Waterlevel >
- Iller - Lech - Bodensee >
- Mühlberg >
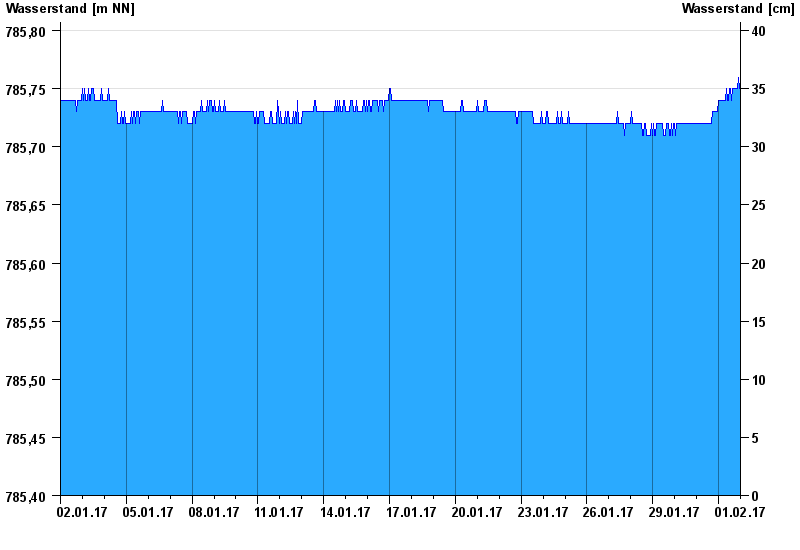
- Chart of month

Chart of month Mühlberg / Bannwaldsee
Waterlevel from 02.01.2017 to 01.02.2017
Linien: keine | Hauptwerte | Meldestufen | mittlerer Seespiegel | Hochwassermarken | historische Ereignisse
| Date | Waterlevel [m above sealevel] |
|---|---|
| 01.02.2017 23:45 | 785.75 |
| 01.02.2017 23:30 | 785.75 |
| 01.02.2017 23:15 | 785.75 |
| 01.02.2017 23:00 | 785.75 |
| 01.02.2017 22:45 | 785.75 |
| 01.02.2017 22:30 | 785.75 |
| 01.02.2017 22:15 | 785.75 |
© Bayerisches Landesamt für Umwelt 2024