
- Start >
- Meteorology >
- Air moisture >
- Bayern >
- Mistelbach >
- Chart of year

Chart of year Mistelbach
Air moisture from 01.01.2022 to 31.12.2022
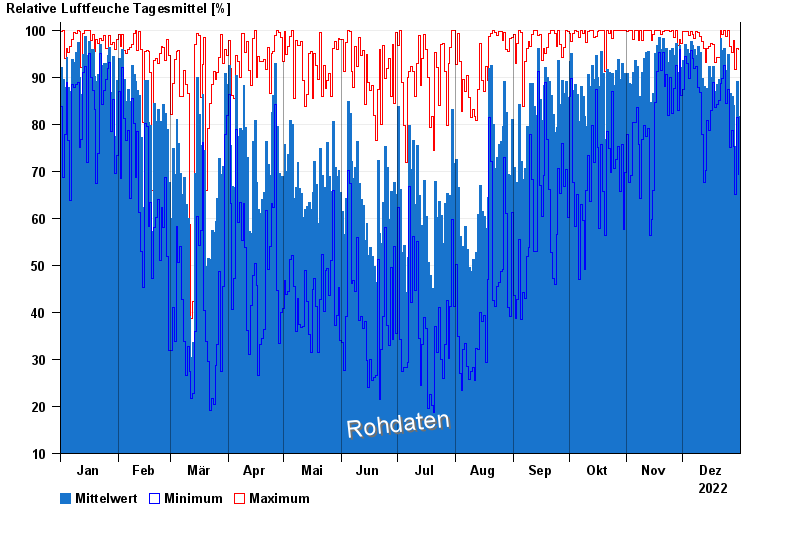
| Date | Mean value [%] | Maximum [%] | Minimum [%] |
|---|---|---|---|
| 31.12.2022 | 81.6 | 96.0 | 69.4 |
| 30.12.2022 | 89.1 | 96.2 | 81.4 |
| 29.12.2022 | 75.2 | 91.6 | 65.0 |
| 28.12.2022 | 84.0 | 97.8 | 75.2 |
| 27.12.2022 | 85.9 | 95.2 | 78.7 |
| 26.12.2022 | 86.5 | 96.6 | 75.0 |
| 25.12.2022 | 94.9 | 99.9 | 87.3 |
© Bayerisches Landesamt für Umwelt 2025