
- Start >
- Meteorology >
- Air moisture >
- Iller - Lech - Bodensee >
- Dürabuch >
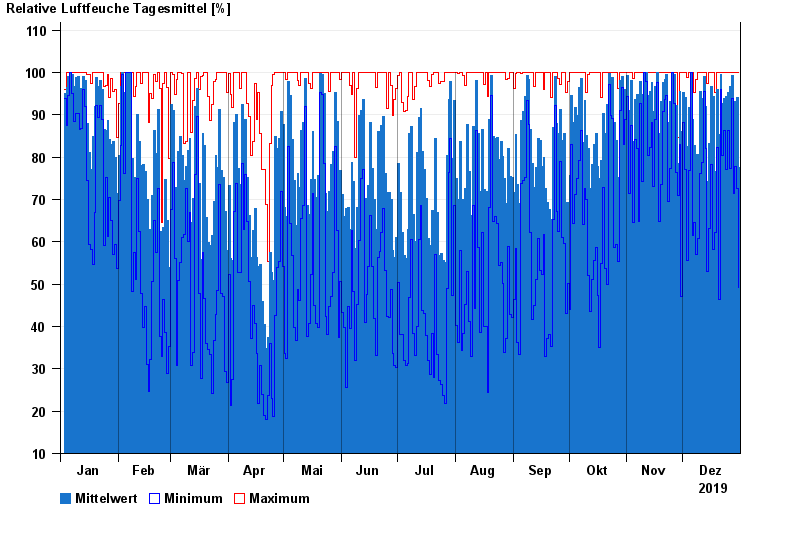
- Chart of year

Chart of year Dürabuch
Air moisture from 01.01.2019 to 31.12.2019
Note: The time series in the selected period has gaps.
| Date | Mean value [%] | Maximum [%] | Minimum [%] |
|---|---|---|---|
| 31.12.2019 | 77.6 | 100.0 | 49.2 |
| 30.12.2019 | 94.0 | 100.0 | 72.6 |
| 29.12.2019 | 93.2 | 100.0 | 77.7 |
| 28.12.2019 | 90.8 | 100.0 | 71.4 |
| 27.12.2019 | 99.4 | 100.0 | 93.8 |
| 26.12.2019 | 96.6 | 100.0 | 77.3 |
| 25.12.2019 | 95.2 | 100.0 | 86.4 |
© Bayerisches Landesamt für Umwelt 2025