
- Start >
- Meteorology >
- Air moisture >
- Inn >
- Nilling >
- Chart of year

Chart of year Nilling
Air moisture from 01.01.2020 to 31.12.2020
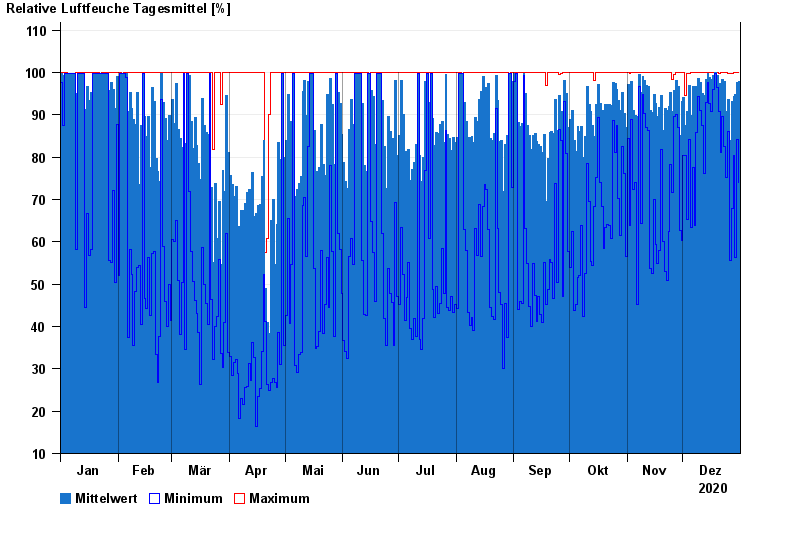
| Date | Mean value [%] | Maximum [%] | Minimum [%] |
|---|---|---|---|
| 31.12.2020 | 97.9 | 99.9 | 74.1 |
| 30.12.2020 | 97.6 | 99.9 | 84.2 |
| 29.12.2020 | 94.7 | 99.9 | 56.3 |
| 28.12.2020 | 94.3 | 99.9 | 80.3 |
| 27.12.2020 | 93.2 | 99.8 | 67.9 |
| 26.12.2020 | 84.0 | 99.8 | 55.7 |
| 25.12.2020 | 93.7 | 99.8 | 86.0 |
© Bayerisches Landesamt für Umwelt 2024