
- Start >
- Meteorology >
- Air moisture >
- Isar >
- Puch >
- Chart of year

Chart of year Puch
Air moisture from 01.01.2020 to 31.12.2020
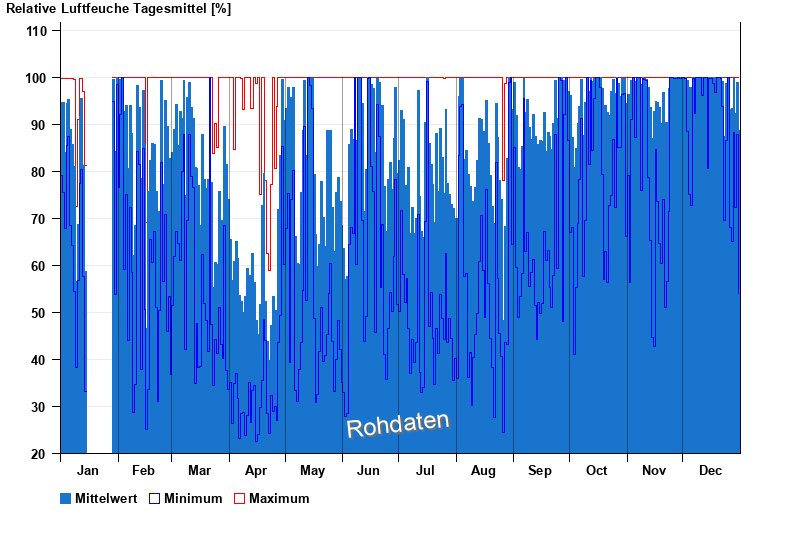
Note: The time series in the selected period has gaps.
| Date | Mean value [%] | Maximum [%] | Minimum [%] |
|---|---|---|---|
| 31.12.2020 | 88.6 | 100.0 | 54.1 |
| 30.12.2020 | 98.8 | 100.0 | 87.8 |
| 29.12.2020 | 92.2 | 100.0 | 72.4 |
| 28.12.2020 | 99.8 | 100.0 | 88.2 |
| 27.12.2020 | 93.4 | 100.0 | 65.1 |
| 26.12.2020 | 93.1 | 100.0 | 68.0 |
| 25.12.2020 | 99.9 | 100.0 | 99.9 |
© Bayerisches Landesamt für Umwelt 2025