
- Start >
- Meteorology >
- Air moisture >
- Obere Donau >
- Puch >
- Chart of year

Chart of year Puch
Air moisture from 29.10.2020 to 28.10.2021
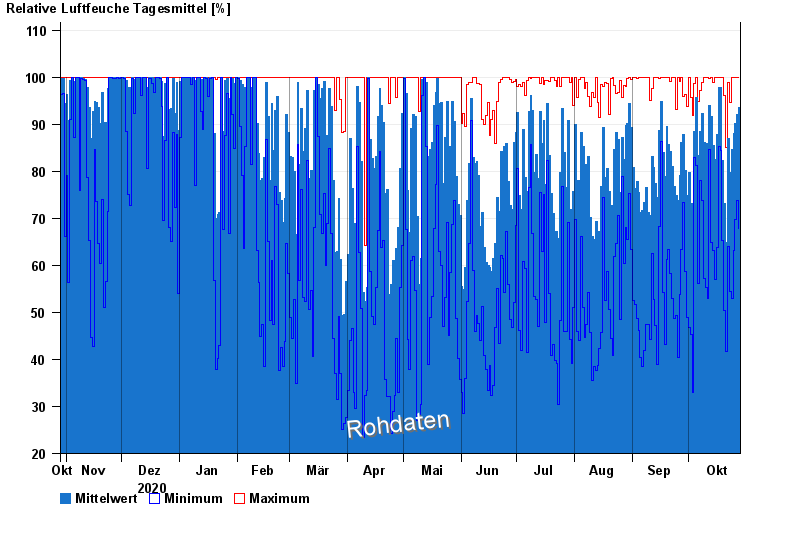
| Date | Mean value [%] | Maximum [%] | Minimum [%] |
|---|---|---|---|
| 28.10.2021 | 93.6 | 100.0 | 67.9 |
| 27.10.2021 | 92.0 | 100.0 | 73.7 |
| 26.10.2021 | 90.1 | 100.0 | 69.8 |
| 25.10.2021 | 88.0 | 100.0 | 63.2 |
| 24.10.2021 | 84.6 | 100.0 | 52.9 |
| 23.10.2021 | 79.7 | 94.6 | 54.5 |
| 22.10.2021 | 86.9 | 98.8 | 64.0 |
© Bayerisches Landesamt für Umwelt 2024