
- Start >
- Meteorology >
- Air moisture >
- Unterer Main >
- Iphofen >
- Chart of year

Chart of year Iphofen
Air moisture from 01.01.2019 to 31.12.2019
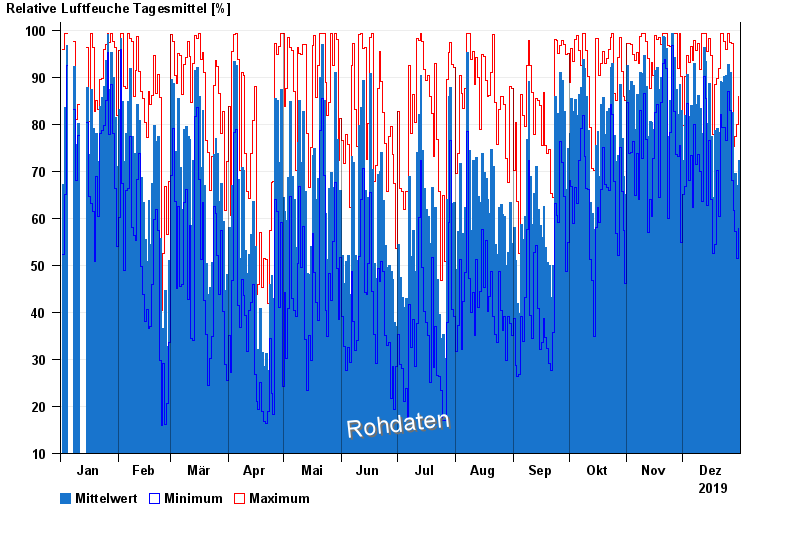
Note: The time series in the selected period has gaps.
| Date | Mean value [%] | Maximum [%] | Minimum [%] |
|---|---|---|---|
| 31.12.2019 | 72.3 | 85.9 | 57.8 |
| 30.12.2019 | 66.9 | 80.0 | 51.4 |
| 29.12.2019 | 69.5 | 77.4 | 57.3 |
| 28.12.2019 | 68.4 | 75.2 | 61.6 |
| 27.12.2019 | 82.6 | 97.1 | 68.0 |
| 26.12.2019 | 91.1 | 97.3 | 83.0 |
| 25.12.2019 | 92.8 | 99.3 | 86.9 |
© Bayerisches Landesamt für Umwelt 2025