
- Start >
- Meteorology >
- Global radiation >
- Bayern >
- Hepberg >
- Chart of year

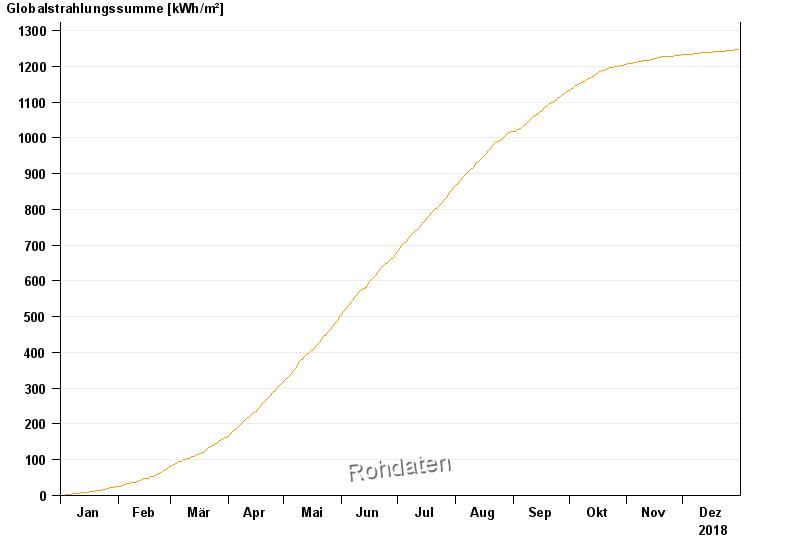
Chart of year Hepberg
Global radiation from 01.01.2018 to 31.12.2018
| Date | Global radiation [Wh/m²] |
|---|---|
| 31.12.2018 | 158.5 |
| 30.12.2018 | 421.5 |
| 29.12.2018 | 427.1 |
| 28.12.2018 | 1291.1 |
| 27.12.2018 | 468.3 |
| 26.12.2018 | 355.5 |
| 25.12.2018 | 423.9 |
© Bayerisches Landesamt für Umwelt 2025