
- Start >
- Meteorology >
- Global radiation >
- Bayern >
- Pösing >
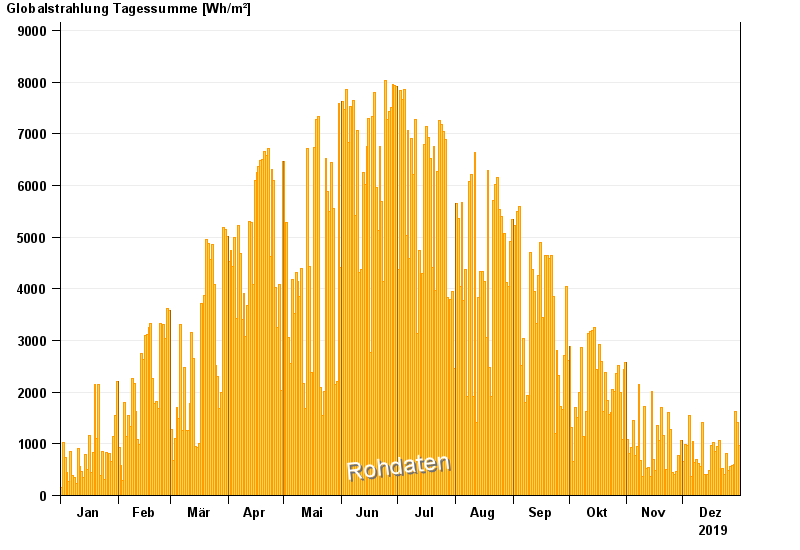
- Chart of year

Chart of year Pösing
Global radiation from 01.01.2019 to 31.12.2019
| Date | Global radiation [Wh/m²] |
|---|---|
| 31.12.2019 | 958.3 |
| 30.12.2019 | 1409.2 |
| 29.12.2019 | 1627.9 |
| 28.12.2019 | 601.6 |
| 27.12.2019 | 573.9 |
| 26.12.2019 | 559.8 |
| 25.12.2019 | 479.1 |
© Bayerisches Landesamt für Umwelt 2025