
- Start >
- Meteorology >
- Global radiation >
- Isar >
- Bärnau >
- Chart of total period

Chart of total period Bärnau
Global radiation from 16.07.1994 to 26.10.2021
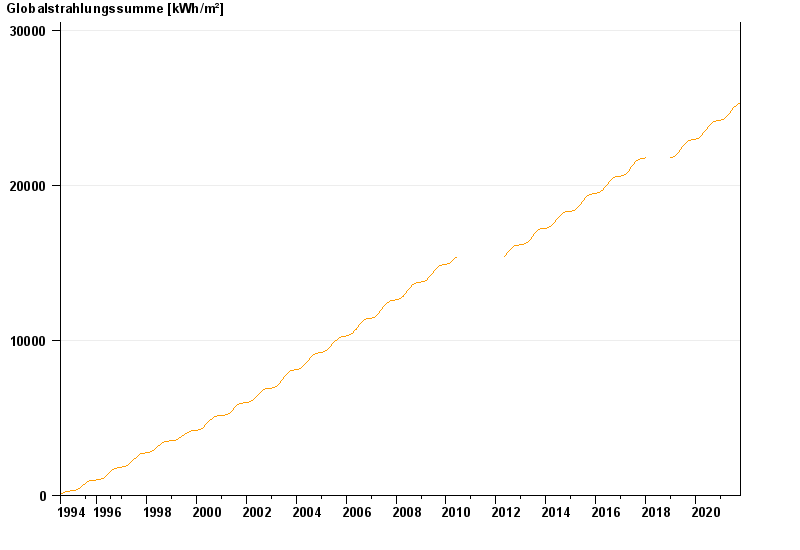
Note: The time series in the selected period has gaps.
| Date | Global radiation [Wh/m²] |
|---|---|
| 26.10.2021 | 1714.5 |
| 25.10.2021 | 1918.2 |
| 24.10.2021 | 3141.8 |
| 23.10.2021 | 1836.2 |
| 22.10.2021 | 1693.0 |
| 21.10.2021 | 1175.8 |
| 20.10.2021 | 2927.5 |
© Bayerisches Landesamt für Umwelt 2024