
- Start >
- Meteorology >
- Global radiation >
- Obere Donau >
- Bischbrunn >
- Chart of year

Chart of year Bischbrunn
Global radiation from 01.01.2019 to 31.12.2019
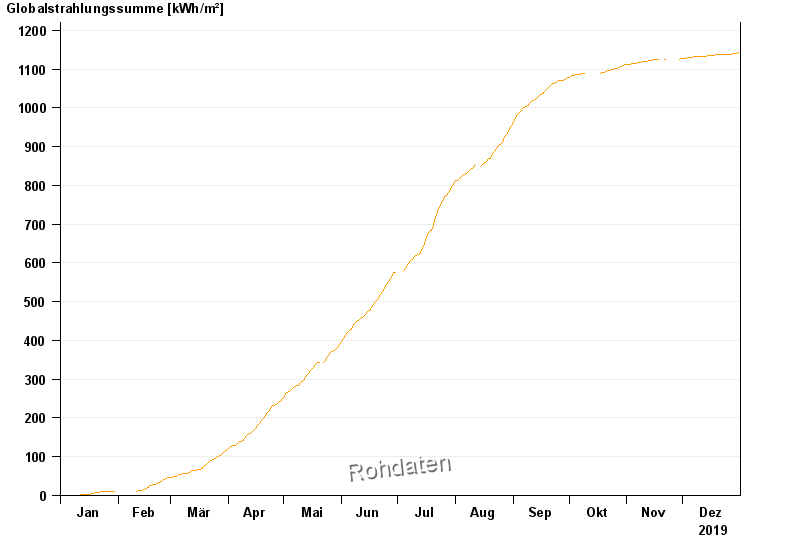
Note: The time series in the selected period has gaps.
| Date | Global radiation [Wh/m²] |
|---|---|
| 31.12.2019 | 630.8 |
| 30.12.2019 | 858.7 |
| 29.12.2019 | 637.5 |
| 28.12.2019 | 954.7 |
| 27.12.2019 | 35.5 |
| 26.12.2019 | 27.2 |
| 25.12.2019 | 294.3 |
© Bayerisches Landesamt für Umwelt 2024