
- Start >
- Meteorology >
- Global radiation >
- Unterer Main >
- Gaibach-Kapellenberg >
- Chart of year

Chart of year Gaibach-Kapellenberg
Global radiation from 01.01.2021 to 31.12.2021
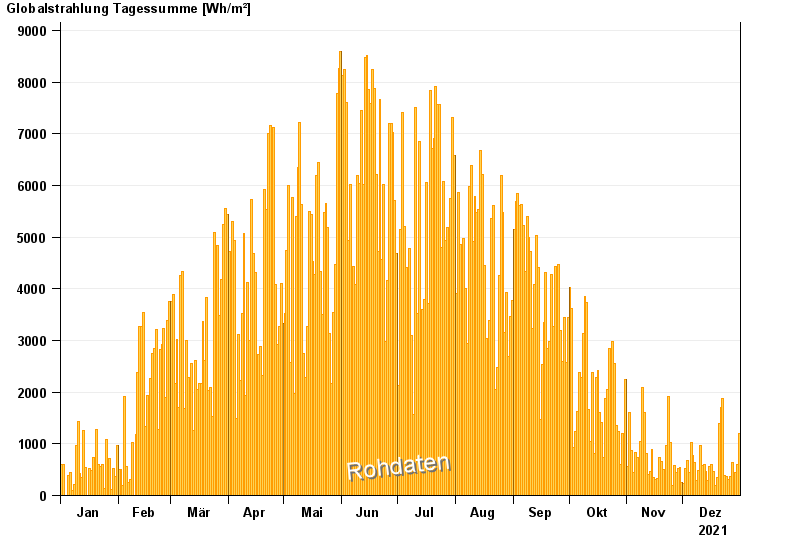
Note: The time series in the selected period has gaps.
| Date | Global radiation [Wh/m²] |
|---|---|
| 31.12.2021 | 1205.5 |
| 30.12.2021 | 608.0 |
| 29.12.2021 | 439.5 |
| 28.12.2021 | 239.4 |
| 27.12.2021 | 641.2 |
| 26.12.2021 | 376.8 |
| 25.12.2021 | 302.9 |
© Bayerisches Landesamt für Umwelt 2025