
- Start >
- Meteorology >
- Global radiation >
- Untere Donau >
- Engersdorf >
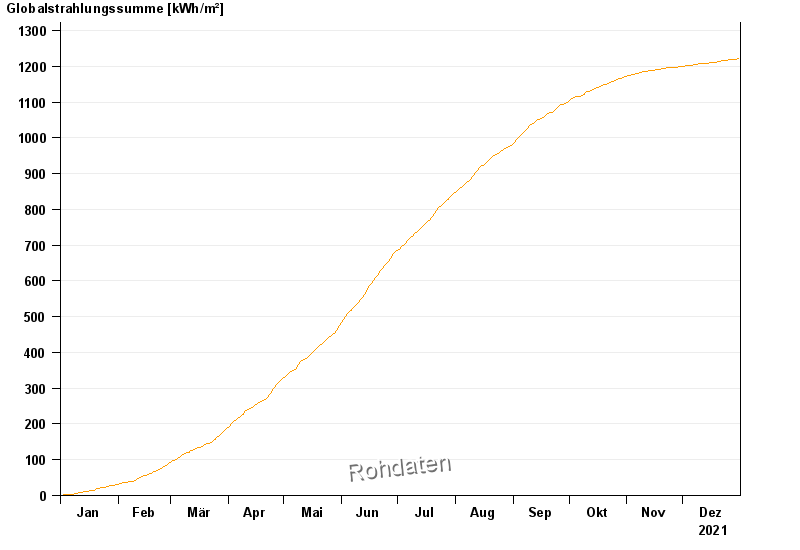
- Chart of year

Chart of year Engersdorf
Global radiation from 01.01.2021 to 31.12.2021
| Date | Global radiation [Wh/m²] |
|---|---|
| 31.12.2021 | 1460.1 |
| 30.12.2021 | 344.2 |
| 29.12.2021 | 656.8 |
| 28.12.2021 | 337.6 |
| 27.12.2021 | 959.2 |
| 26.12.2021 | 674.6 |
| 25.12.2021 | 260.9 |
© Bayerisches Landesamt für Umwelt 2025