
- Start >
- Meteorology >
- Global radiation >
- Regnitz >
- Bischbrunn >
- Chart of year

Chart of year Bischbrunn
Global radiation from 01.01.2018 to 31.12.2018
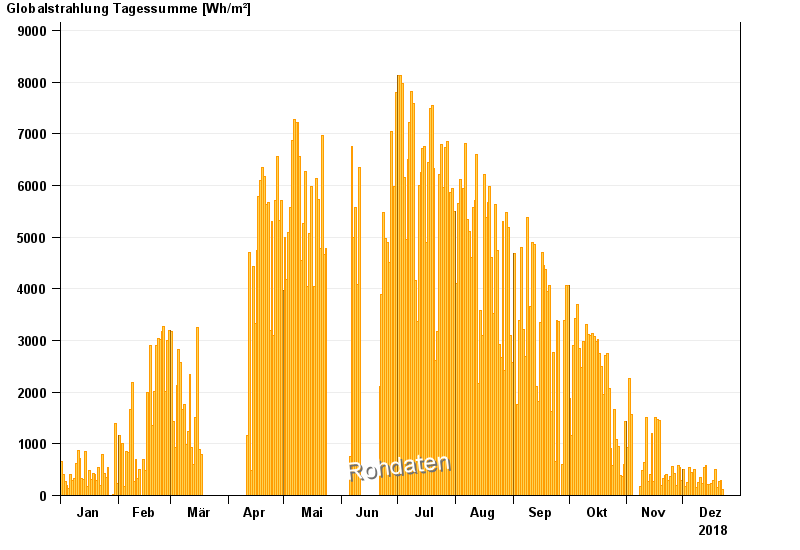
Note: The time series in the selected period has gaps.
| Date | Global radiation [Wh/m²] |
|---|---|
| 22.12.2018 | 113.7 |
| 21.12.2018 | 283.5 |
| 20.12.2018 | 270.9 |
| 19.12.2018 | 160.5 |
| 18.12.2018 | 506.0 |
| 17.12.2018 | 292.3 |
| 16.12.2018 | 241.7 |
© Bayerisches Landesamt für Umwelt 2024