
- Start >
- Meteorology >
- Global radiation >
- Regnitz >
- Triesdorf >
- Chart of year

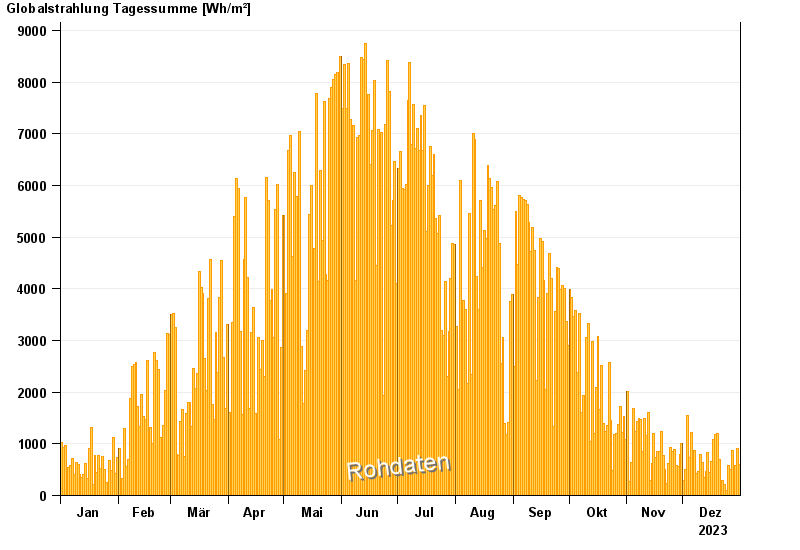
Chart of year Triesdorf
Global radiation from 01.01.2023 to 31.12.2023
| Date | Global radiation [Wh/m²] |
|---|---|
| 31.12.2023 | 590.4 |
| 30.12.2023 | 903.0 |
| 29.12.2023 | 588.7 |
| 28.12.2023 | 484.3 |
| 27.12.2023 | 868.0 |
| 26.12.2023 | 496.2 |
| 25.12.2023 | 587.9 |
© Bayerisches Landesamt für Umwelt 2024