
- Start >
- Rivers >
- Chemistry >
- Bayern >
- Pegel Grabenstätt >
- Chart of year

Chart of year Pegel Grabenstätt / Rothgraben
Data from 2020-11-30 to 2021-11-29
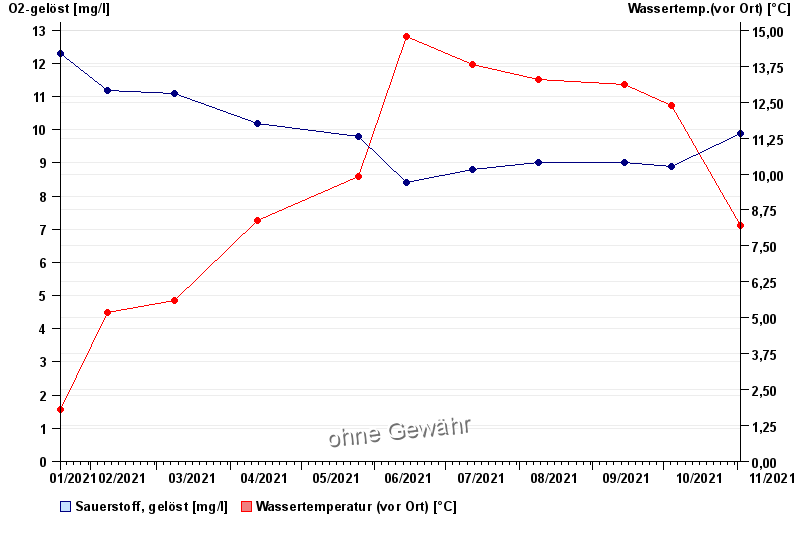
| Date | O2-gelöst [mg/l] | Wassertemp.(vor Ort) [°C] |
|---|---|---|
| 29.11.2021 | 10.9 | 4.4 |
| 02.11.2021 | 9.9 | 8.2 |
| 04.10.2021 | 8.9 | 12.4 |
| 14.09.2021 | 9 | 13.1 |
| 09.08.2021 | 9 | 13.3 |
| 12.07.2021 | 8.8 | 13.8 |
| 14.06.2021 | 8.4 | 14.8 |
© Bayerisches Landesamt für Umwelt 2025