

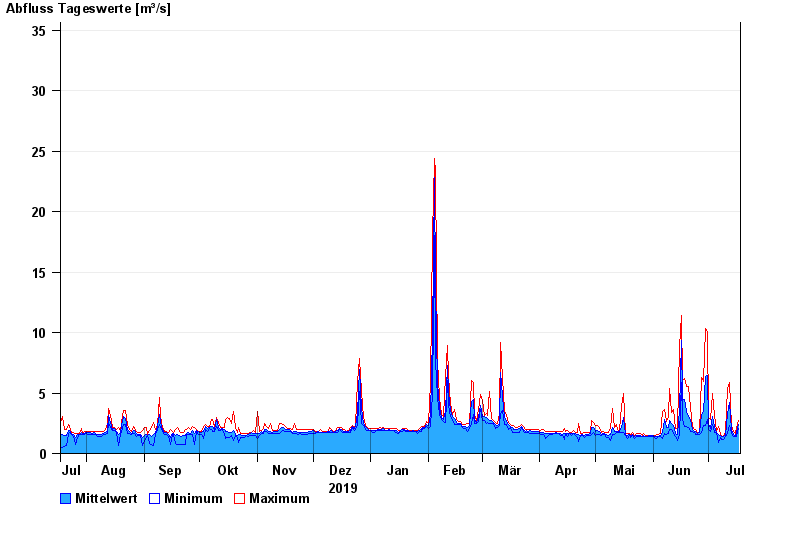
Chart of year Aham / Vils
Discharge from 18.07.2019 to 17.07.2020
- 03.06.2013 Abfluss: 231 m³/s
- 01.02.1985 Abfluss: 197 m³/s
- 04.08.1991 Abfluss: 196 m³/s
- 22.02.1970 Abfluss: 194 m³/s
- 20.02.1999 Abfluss: 176 m³/s
| Date | Mean value [m³/s] | Maximum [m³/s] | Minimum [m³/s] |
|---|---|---|---|
| 17.07.2020 | 2.39 | 2.73 | 2.04 |
| 16.07.2020 | 1.73 | 2.18 | 1.37 |
| 15.07.2020 | 1.52 | 1.64 | 1.37 |
| 14.07.2020 | 1.55 | 1.78 | 1.38 |
| 13.07.2020 | 1.94 | 2.35 | 1.65 |
| 12.07.2020 | 4.22 | 5.84 | 2.35 |
| 11.07.2020 | 3.28 | 5.35 | 1.66 |
© Bayerisches Landesamt für Umwelt 2024