

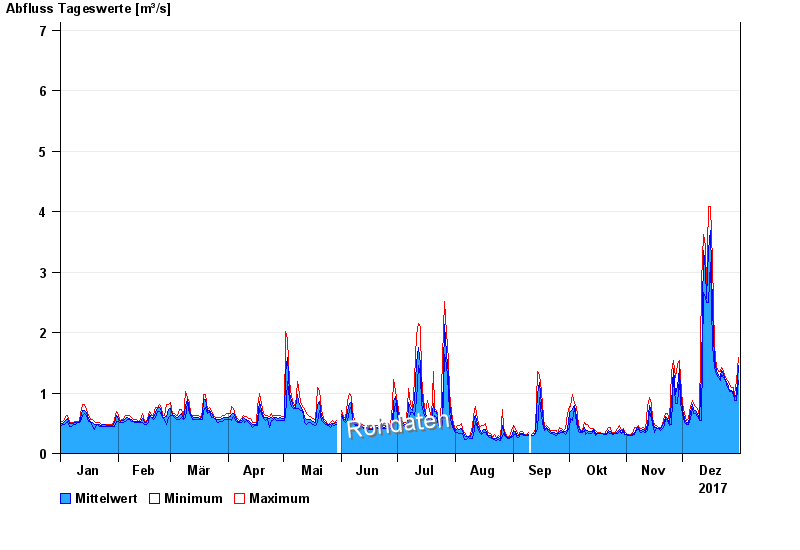
Chart of year Arnstein / Wern
Discharge from 01.01.2017 to 31.12.2017
- 26.01.1995 Abfluss: 26,7 m³/s
- 03.07.2009 Abfluss: 26,3 m³/s
- 01.06.2013 Abfluss: 24,3 m³/s
- 06.01.1982 Abfluss: 24,2 m³/s
- 03.01.2003 Abfluss: 23,6 m³/s
| Date | Mean value [m³/s] | Maximum [m³/s] | Minimum [m³/s] |
|---|---|---|---|
| 31.12.2017 | 1.53 | 1.64 | 1.29 |
| 30.12.2017 | 1.11 | 1.29 | 1.02 |
| 29.12.2017 | 1.05 | 1.12 | 1.02 |
| 28.12.2017 | 1.16 | 1.23 | 1.07 |
| 27.12.2017 | 1.17 | 1.23 | 1.12 |
| 26.12.2017 | 1.17 | 1.23 | 1.12 |
| 25.12.2017 | 1.2 | 1.28 | 1.17 |
© Bayerisches Landesamt für Umwelt 2024