
- Start >
- Rivers >
- Discharge >
- Bayern >
- Bad Kissingen Golfplatz >
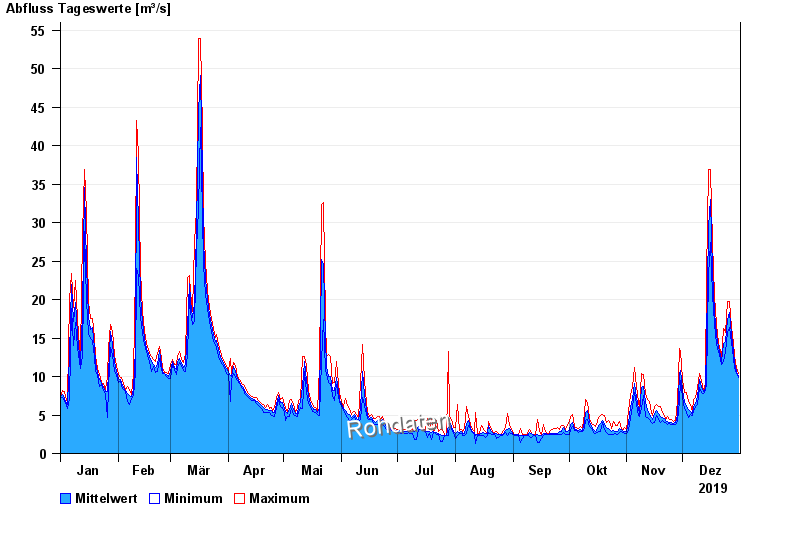
- Chart of year

Chart of year Bad Kissingen Golfplatz / Fränkische Saale
Discharge from 01.01.2019 to 31.12.2019
| Date | Mean value [m³/s] | Maximum [m³/s] | Minimum [m³/s] |
|---|---|---|---|
| 31.12.2019 | 10 | 10.4 | 9.82 |
| 30.12.2019 | 10.7 | 11.2 | 10.4 |
| 29.12.2019 | 11.8 | 12.6 | 11.2 |
| 28.12.2019 | 13.3 | 14.4 | 12.4 |
| 27.12.2019 | 15.4 | 16.4 | 14.4 |
| 26.12.2019 | 18.3 | 19.7 | 16.4 |
| 25.12.2019 | 17.4 | 19.7 | 15.7 |
© Bayerisches Landesamt für Umwelt 2025