

Chart of year Bad Trißl / Auerbach
Discharge from 01.01.2022 to 31.12.2022
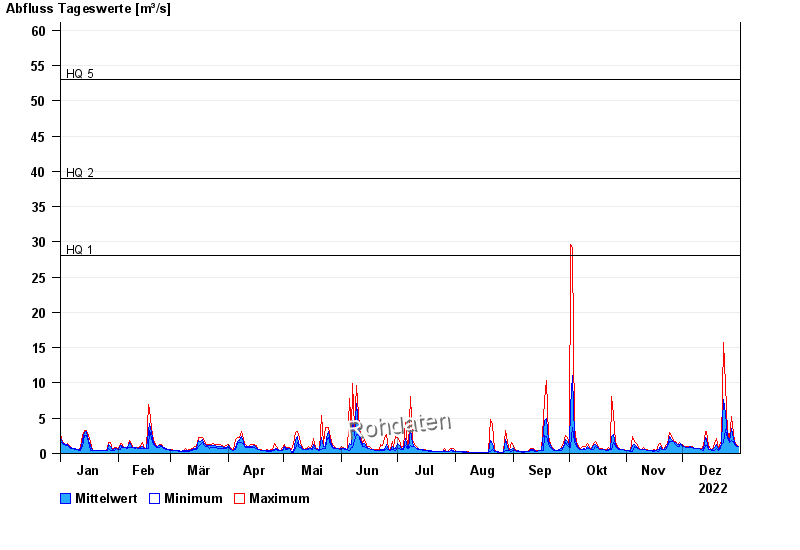
- HQ1 28 m³/s
- HQ2 39 m³/s
- HQ5 53 m³/s
- HQ10 64 m³/s
- HQ20 75 m³/s
- HQ50 90 m³/s
- HQ100 100 m³/s
| Date | Mean value [m³/s] | Maximum [m³/s] | Minimum [m³/s] |
|---|---|---|---|
| 31.12.2022 | 0.716 | 0.716 | 0.716 |
| 30.12.2022 | 0.799 | 0.901 | 0.716 |
| 29.12.2022 | 1.05 | 1.23 | 0.901 |
| 28.12.2022 | 1.56 | 2.08 | 1.23 |
| 27.12.2022 | 2.72 | 4.29 | 1.36 |
| 26.12.2022 | 1.25 | 1.49 | 1.12 |
| 25.12.2022 | 1.91 | 2.42 | 1.49 |
© Bayerisches Landesamt für Umwelt 2024