

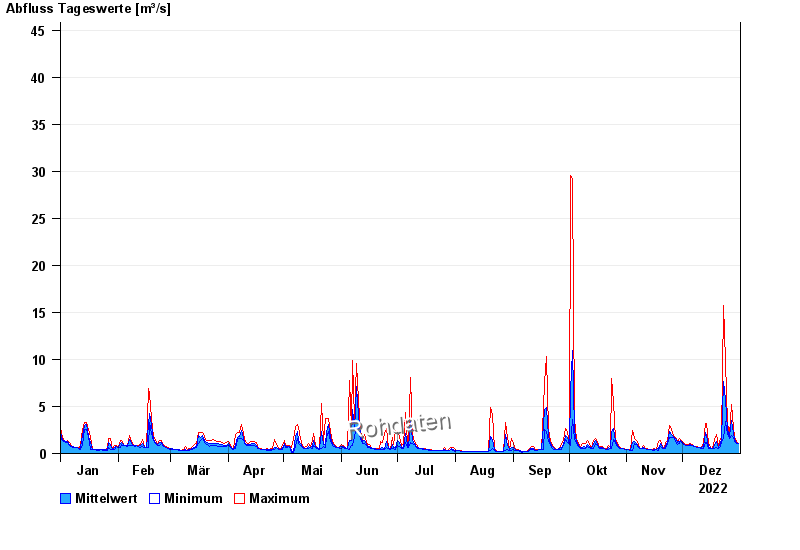
Chart of year Bad Trißl / Auerbach
Discharge from 01.01.2022 to 31.12.2022
- 31.07.1977 Abfluss: 90,6 m³/s
- 21.05.1999 Abfluss: 79 m³/s
- 20.07.1981 Abfluss: 75,8 m³/s
- 12.08.2002 Abfluss: 73,3 m³/s
- 24.08.1955 Abfluss: 70,9 m³/s
| Date | Mean value [m³/s] | Maximum [m³/s] | Minimum [m³/s] |
|---|---|---|---|
| 31.12.2022 | 0.716 | 0.716 | 0.716 |
| 30.12.2022 | 0.799 | 0.901 | 0.716 |
| 29.12.2022 | 1.05 | 1.23 | 0.901 |
| 28.12.2022 | 1.56 | 2.08 | 1.23 |
| 27.12.2022 | 2.72 | 4.29 | 1.36 |
| 26.12.2022 | 1.25 | 1.49 | 1.12 |
| 25.12.2022 | 1.91 | 2.42 | 1.49 |
© Bayerisches Landesamt für Umwelt 2024