

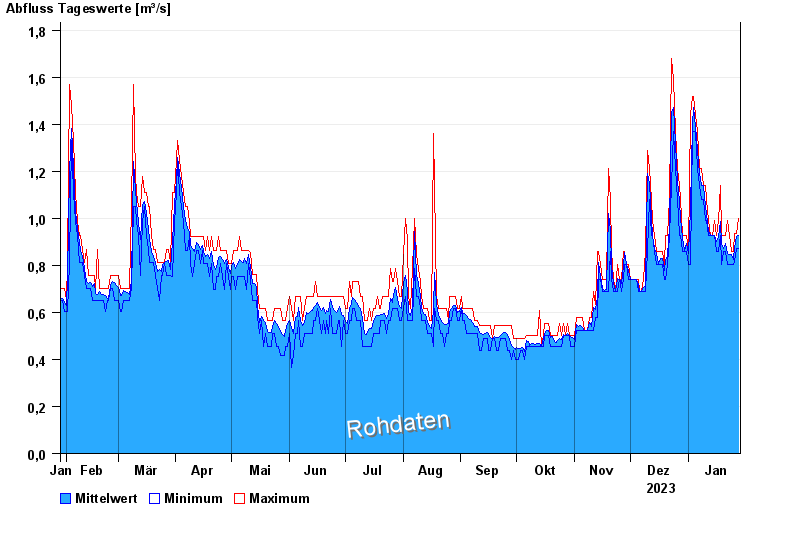
Chart of year Bärenthal / Trubach
Discharge from 29.01.2023 to 28.01.2024
note
Absinken des Wasserstandes wegen Entfernung von Auflandungen.
| Date | Mean value [m³/s] | Maximum [m³/s] | Minimum [m³/s] |
|---|---|---|---|
| 28.01.2024 | 0.925 | 1 | 0.87 |
| 27.01.2024 | 0.923 | 0.935 | 0.87 |
| 26.01.2024 | 0.877 | 0.935 | 0.815 |
| 25.01.2024 | 0.823 | 0.86 | 0.805 |
| 24.01.2024 | 0.845 | 0.86 | 0.805 |
| 23.01.2024 | 0.848 | 0.925 | 0.805 |
| 22.01.2024 | 0.851 | 0.99 | 0.805 |
© Bayerisches Landesamt für Umwelt 2024