

Chart of year Bairawies / Zeller Bach
Discharge from 01.01.2021 to 31.12.2021
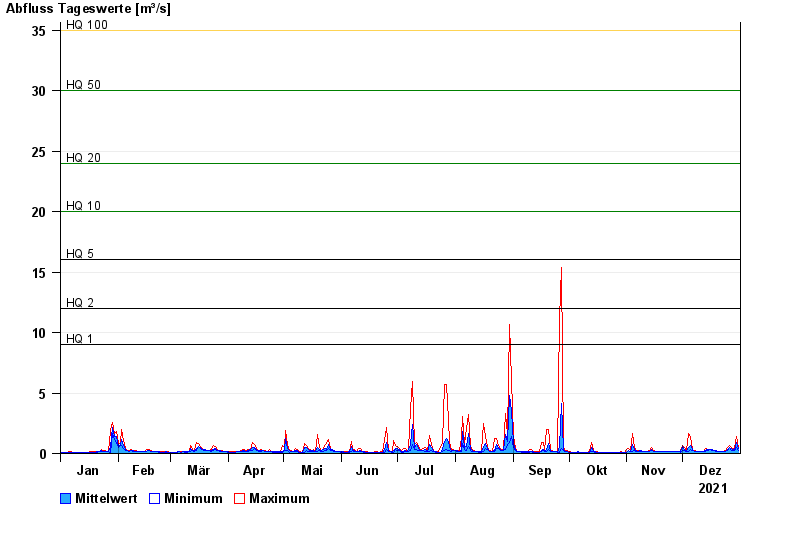
- HQ1 9 m³/s
- HQ2 12 m³/s
- HQ5 16 m³/s
- HQ10 20 m³/s
- HQ20 24 m³/s
- HQ50 30 m³/s
- HQ100 35 m³/s
| Date | Mean value [m³/s] | Maximum [m³/s] | Minimum [m³/s] |
|---|---|---|---|
| 31.12.2021 | 0.377 | 0.508 | 0.288 |
| 30.12.2021 | 0.898 | 1.43 | 0.456 |
| 29.12.2021 | 0.321 | 0.456 | 0.288 |
| 28.12.2021 | 0.31 | 0.408 | 0.255 |
| 27.12.2021 | 0.377 | 0.508 | 0.288 |
| 26.12.2021 | 0.534 | 0.63 | 0.456 |
| 25.12.2021 | 0.34 | 0.508 | 0.255 |
© Bayerisches Landesamt für Umwelt 2024