

Chart of year Bairawies / Zeller Bach
Discharge from 01.01.2019 to 31.12.2019
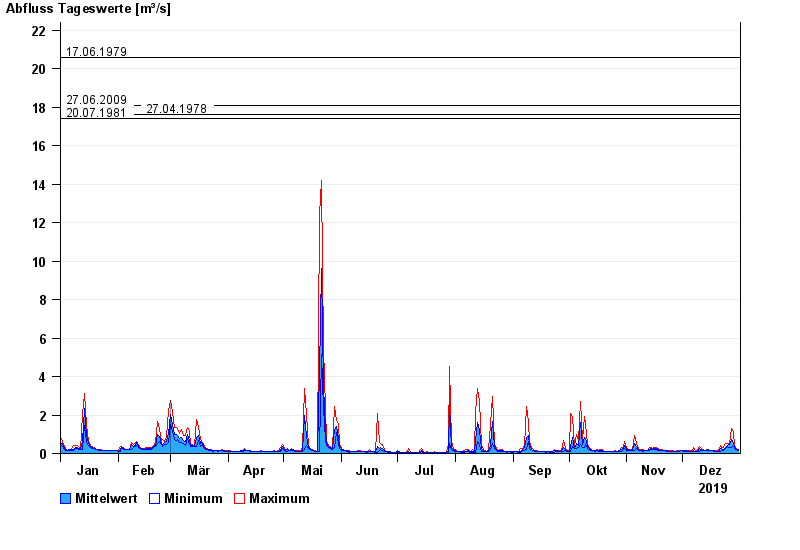
- 21.05.1999 Abfluss: 26,5 m³/s
- 17.06.1979 Abfluss: 20,6 m³/s
- 27.06.2009 Abfluss: 18,1 m³/s
- 27.04.1978 Abfluss: 17,6 m³/s
- 20.07.1981 Abfluss: 17,4 m³/s
| Date | Mean value [m³/s] | Maximum [m³/s] | Minimum [m³/s] |
|---|---|---|---|
| 31.12.2019 | 0.19 | 0.226 | 0.174 |
| 30.12.2019 | 0.227 | 0.255 | 0.197 |
| 29.12.2019 | 0.308 | 0.405 | 0.253 |
| 28.12.2019 | 0.597 | 1.09 | 0.361 |
| 27.12.2019 | 0.721 | 1.28 | 0.313 |
| 26.12.2019 | 0.453 | 0.543 | 0.313 |
| 25.12.2019 | 0.426 | 0.541 | 0.345 |
© Bayerisches Landesamt für Umwelt 2024