

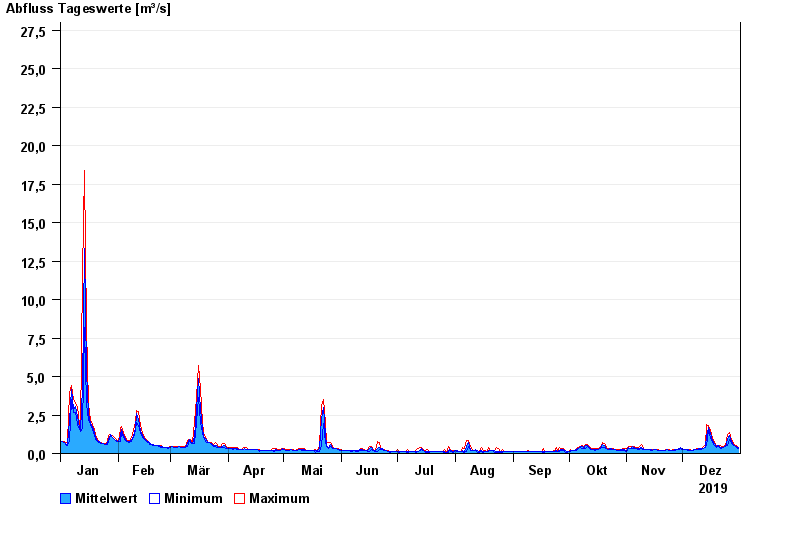
Chart of year Bechhofen / Wieseth
Discharge from 01.01.2019 to 31.12.2019
- 21.12.1993 Abfluss: 49,7 m³/s
- 29.10.1998 Abfluss: 36,3 m³/s
- 09.03.2006 Abfluss: 33,6 m³/s
- 26.02.1997 Abfluss: 28,7 m³/s
- 22.02.1970 Abfluss: 27,8 m³/s
| Date | Mean value [m³/s] | Maximum [m³/s] | Minimum [m³/s] |
|---|---|---|---|
| 31.12.2019 | 0.386 | 0.397 | 0.353 |
| 30.12.2019 | 0.431 | 0.496 | 0.397 |
| 29.12.2019 | 0.513 | 0.551 | 0.495 |
| 28.12.2019 | 0.574 | 0.675 | 0.551 |
| 27.12.2019 | 0.759 | 0.895 | 0.675 |
| 26.12.2019 | 1.15 | 1.36 | 0.895 |
| 25.12.2019 | 0.895 | 1.26 | 0.494 |
© Bayerisches Landesamt für Umwelt 2024