

Chart of year Bürgstadt / Erf
Discharge from 29.03.2024 to 28.03.2025
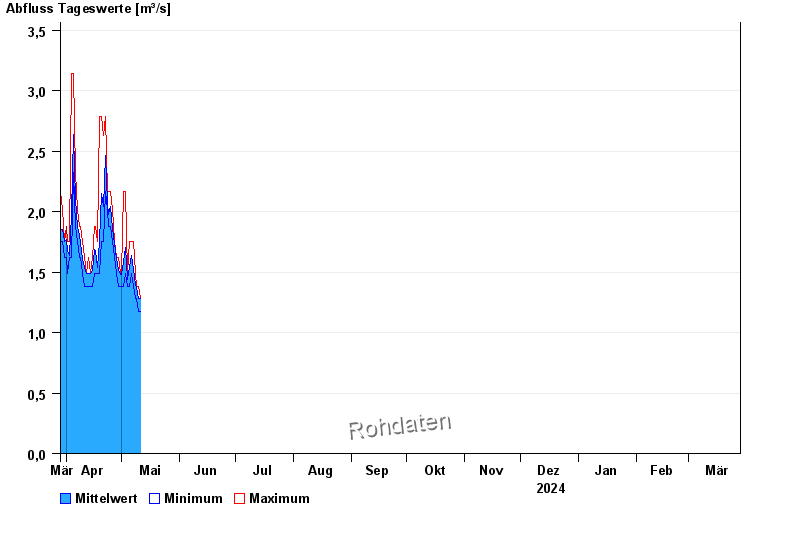
| Date | Mean value [m³/s] | Maximum [m³/s] | Minimum [m³/s] |
|---|---|---|---|
| 16.07.2024 | 1.53 | 1.87 | 1.37 |
| 15.07.2024 | 1.24 | 1.37 | 1.05 |
| 14.07.2024 | 1.35 | 2.01 | 0.497 |
| 13.07.2024 | 1.75 | 2.29 | 0.856 |
| 12.07.2024 | 2.9 | 9.08 | 1.05 |
| 11.07.2024 | 1.48 | 2.29 | 1.15 |
| 10.07.2024 | 1.16 | 1.61 | 0.69 |
© Bayerisches Landesamt für Umwelt 2024