
- Start >
- Rivers >
- Discharge >
- Bayern >
- Deggendorf >
- Chart of year

Chart of year Deggendorf / Kollbach
Discharge from 01.01.2024 to 31.12.2024
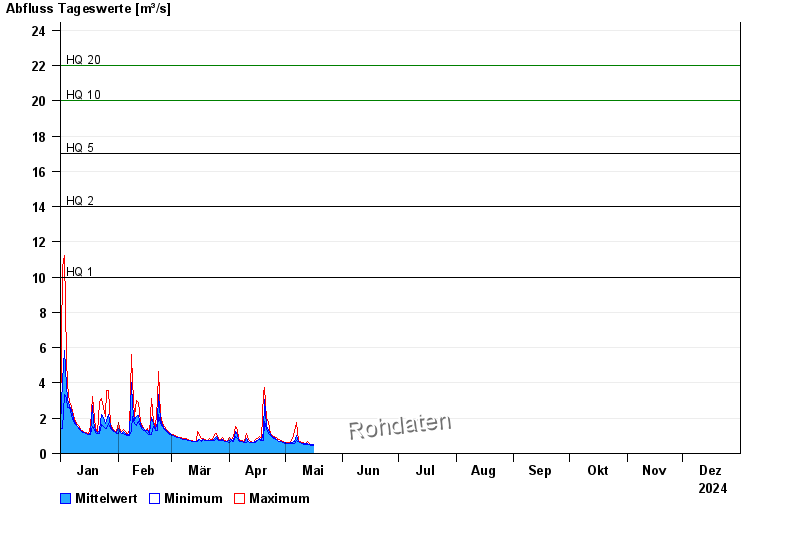
- HQ1 10 m³/s
- HQ2 14 m³/s
- HQ5 17 m³/s
- HQ10 20 m³/s
- HQ20 22 m³/s
- HQ50 25 m³/s
- HQ100 27 m³/s
| Date | Mean value [m³/s] | Maximum [m³/s] | Minimum [m³/s] |
|---|---|---|---|
| 31.12.2024 | 0.508 | 0.54 | 0.491 |
| 30.12.2024 | 0.54 | 0.54 | 0.54 |
| 29.12.2024 | 0.567 | 0.59 | 0.54 |
| 28.12.2024 | 0.608 | 0.645 | 0.59 |
| 27.12.2024 | 0.656 | 0.7 | 0.645 |
| 26.12.2024 | 0.719 | 0.758 | 0.7 |
| 25.12.2024 | 0.805 | 0.878 | 0.758 |
© Bayerisches Landesamt für Umwelt 2025