

Chart of year Deuerling / Schwarze Laber
Discharge from 01.01.2021 to 31.12.2021
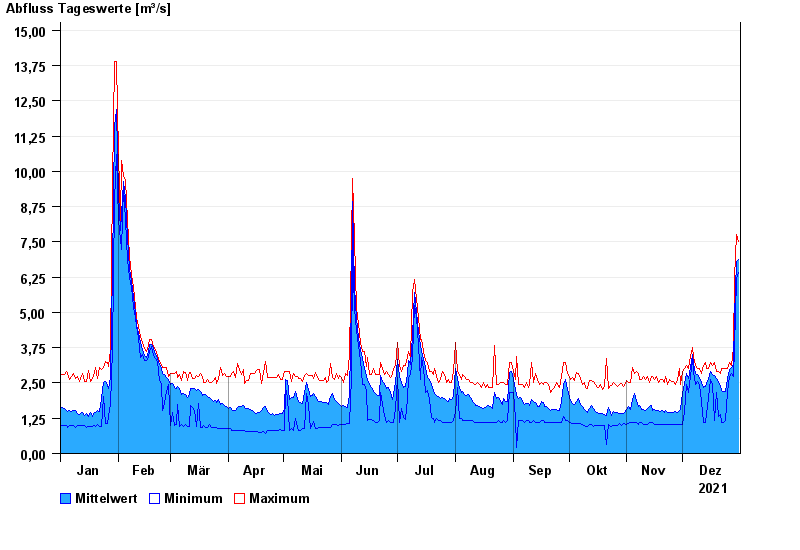
| Date | Mean value [m³/s] | Maximum [m³/s] | Minimum [m³/s] |
|---|---|---|---|
| 31.12.2021 | 6.86 | 7.52 | 6.43 |
| 30.12.2021 | 6.8 | 7.76 | 6.2 |
| 29.12.2021 | 4.82 | 6.2 | 3.74 |
| 28.12.2021 | 3.14 | 3.74 | 2.73 |
| 27.12.2021 | 3.03 | 3.12 | 2.83 |
| 26.12.2021 | 2.97 | 3.22 | 2.73 |
| 25.12.2021 | 2.64 | 3.02 | 2.17 |
© Bayerisches Landesamt für Umwelt 2025