
- Start >
- Rivers >
- Discharge >
- Bayern >
- Eberhardsreuth >
- Chart of year

Chart of year Eberhardsreuth / Mitternacher Ohe
Discharge from 19.04.2024 to 18.04.2025
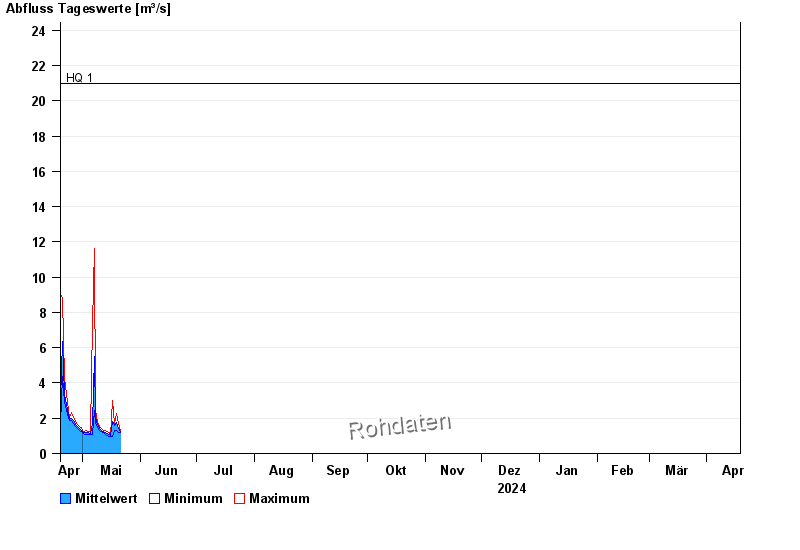
- HQ1 21 m³/s
- HQ2 27,5 m³/s
- HQ5 35 m³/s
- HQ10 42 m³/s
- HQ20 50 m³/s
- HQ50 64 m³/s
- HQ100 75 m³/s
| Date | Mean value [m³/s] | Maximum [m³/s] | Minimum [m³/s] |
|---|---|---|---|
| 16.01.2025 | 1.7 | 1.7 | 1.7 |
| 15.01.2025 | 1.82 | 1.95 | 1.7 |
| 14.01.2025 | 1.98 | 2.31 | 1.62 |
| 13.01.2025 | 1.92 | 2.13 | 1.7 |
| 12.01.2025 | 2.16 | 2.31 | 2.03 |
| 11.01.2025 | 2.52 | 2.88 | 2.31 |
| 10.01.2025 | 4.29 | 7.11 | 2.88 |
© Bayerisches Landesamt für Umwelt 2025