
- Start >
- Rivers >
- Discharge >
- Bayern >
- Eggenfelden >
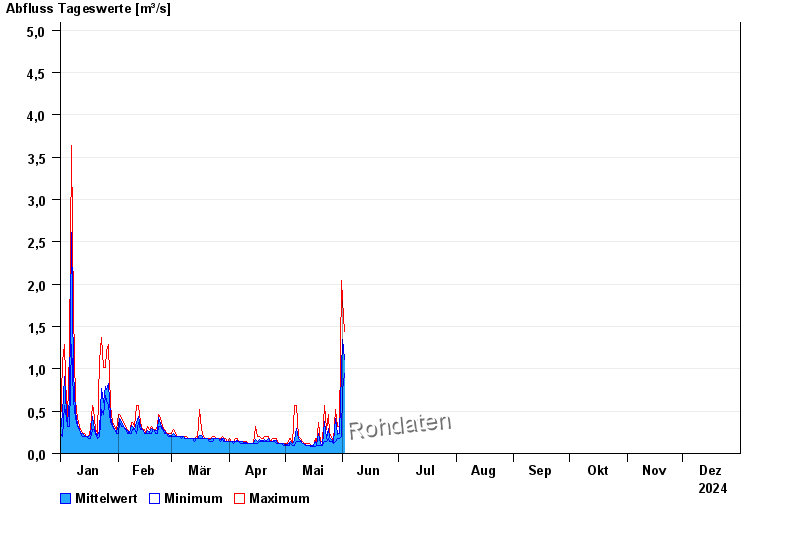
- Chart of year

Chart of year Eggenfelden / Mertseebach
Discharge from 01.01.2024 to 31.12.2024
- 02.03.1987 Abfluss: 13,3 m³/s
- 13.01.2011 Abfluss: 12,8 m³/s
- 02.06.2013 Abfluss: 11,5 m³/s
- 02.08.1991 Abfluss: 11,2 m³/s
- 17.07.2010 Abfluss: 9,99 m³/s
| Date | Mean value [m³/s] | Maximum [m³/s] | Minimum [m³/s] |
|---|---|---|---|
| 22.11.2024 | 0.189 | 0.2 | 0.169 |
| 21.11.2024 | 0.247 | 0.362 | 0.2 |
| 20.11.2024 | 0.628 | 1.15 | 0.169 |
| 19.11.2024 | 0.139 | 0.169 | 0.116 |
| 18.11.2024 | 0.116 | 0.116 | 0.116 |
| 17.11.2024 | 0.097 | 0.116 | 0.095 |
| 16.11.2024 | 0.105 | 0.141 | 0.095 |
© Bayerisches Landesamt für Umwelt 2024