
- Start >
- Rivers >
- Discharge >
- Bayern >
- Fahrenbühl >
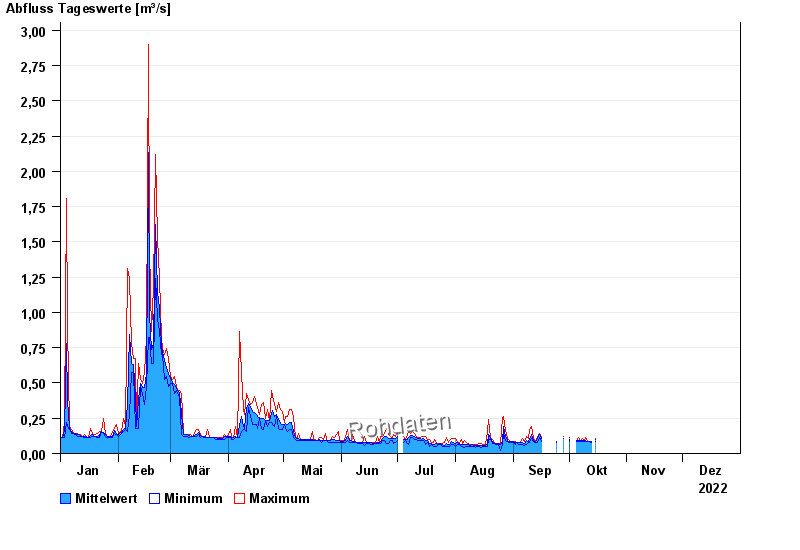
- Chart of year

Chart of year Fahrenbühl / Lamitz
Discharge from 01.01.2022 to 31.12.2022
| Date | Mean value [m³/s] | Maximum [m³/s] | Minimum [m³/s] |
|---|---|---|---|
| 15.10.2022 | 0.097 | 0.104 | 0.085 |
| 14.10.2022 | -- | -- | -- |
| 13.10.2022 | 0.084 | 0.085 | 0.076 |
| 12.10.2022 | 0.085 | 0.085 | 0.085 |
| 11.10.2022 | 0.085 | 0.085 | 0.085 |
| 10.10.2022 | 0.09 | 0.114 | 0.085 |
| 09.10.2022 | 0.092 | 0.095 | 0.085 |
© Bayerisches Landesamt für Umwelt 2025