
- Start >
- Rivers >
- Discharge >
- Bayern >
- Förmitz Speicherzufluss >
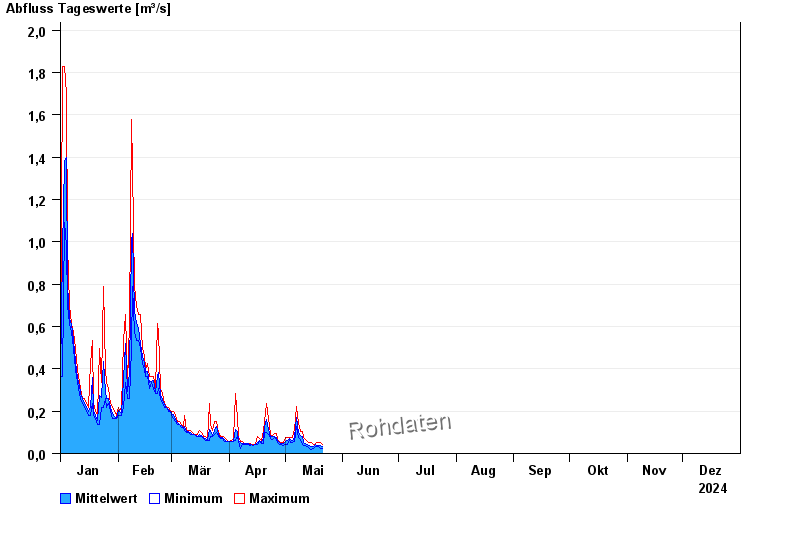
- Chart of year

Chart of year Förmitz Speicherzufluss / Förmitz
Discharge from 01.01.2024 to 31.12.2024
| Date | Mean value [m³/s] | Maximum [m³/s] | Minimum [m³/s] |
|---|---|---|---|
| 31.12.2024 | 0.145 | 0.153 | 0.139 |
| 30.12.2024 | 0.153 | 0.153 | 0.153 |
| 29.12.2024 | 0.159 | 0.168 | 0.153 |
| 28.12.2024 | 0.17 | 0.184 | 0.168 |
| 27.12.2024 | 0.183 | 0.184 | 0.168 |
| 26.12.2024 | 0.191 | 0.201 | 0.184 |
| 25.12.2024 | 0.203 | 0.219 | 0.201 |
© Bayerisches Landesamt für Umwelt 2025