
- Start >
- Rivers >
- Discharge >
- Bayern >
- Friedersdorf >
- Chart of year

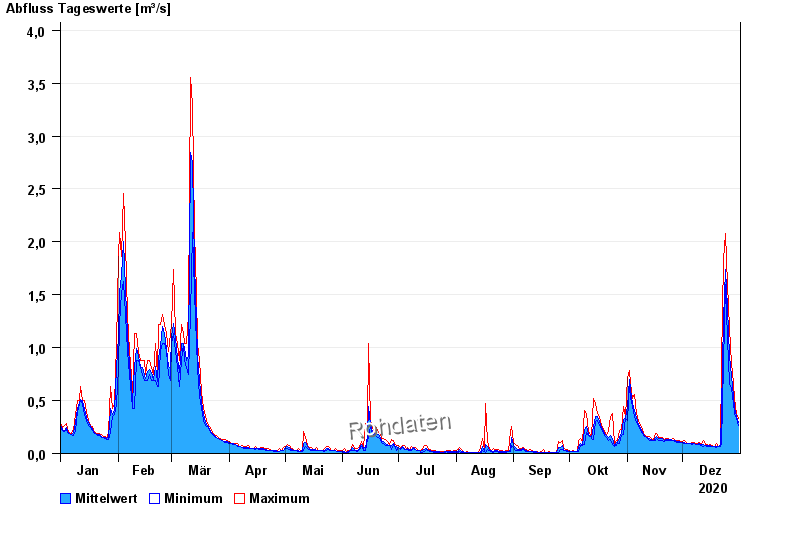
Chart of year Friedersdorf / Buchbach
Discharge from 01.01.2020 to 31.12.2020
| Date | Mean value [m³/s] | Maximum [m³/s] | Minimum [m³/s] |
|---|---|---|---|
| 31.12.2020 | 0.297 | 0.33 | 0.265 |
| 30.12.2020 | 0.348 | 0.378 | 0.33 |
| 29.12.2020 | 0.422 | 0.517 | 0.378 |
| 28.12.2020 | 0.549 | 0.664 | 0.476 |
| 27.12.2020 | 0.728 | 0.855 | 0.61 |
| 26.12.2020 | 0.918 | 1.18 | 0.664 |
| 25.12.2020 | 1.38 | 1.6 | 1.09 |
© Bayerisches Landesamt für Umwelt 2025