
- Start >
- Rivers >
- Discharge >
- Bayern >
- Fritz am Sand >
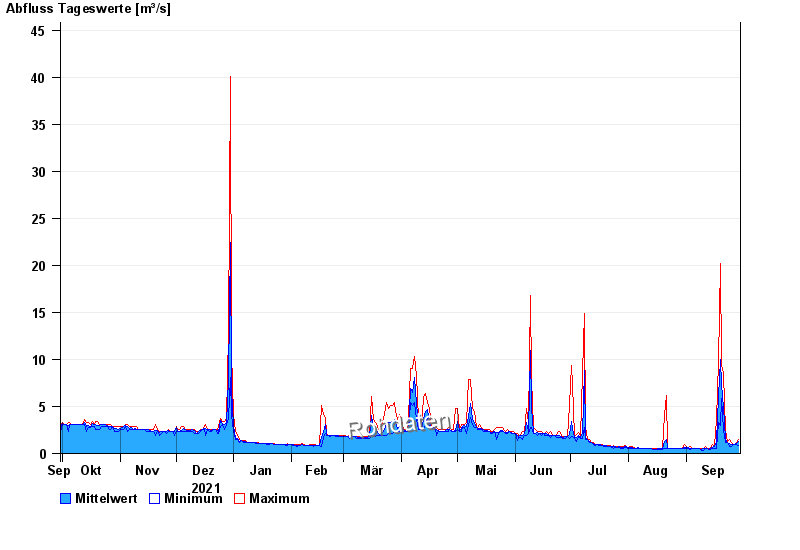
- Chart of year

Chart of year Fritz am Sand / Weiße Traun
Discharge from 30.09.2021 to 29.09.2022
| Date | Mean value [m³/s] | Maximum [m³/s] | Minimum [m³/s] |
|---|---|---|---|
| 29.09.2022 | 1.23 | 1.45 | 0.884 |
| 28.09.2022 | 1.02 | 1.14 | 1 |
| 27.09.2022 | 1 | 1 | 1 |
| 26.09.2022 | 1 | 1 | 1 |
| 25.09.2022 | 0.957 | 1.14 | 0.769 |
| 24.09.2022 | 1.06 | 1.45 | 0.769 |
| 23.09.2022 | 1.15 | 1.29 | 1.14 |
© Bayerisches Landesamt für Umwelt 2024