

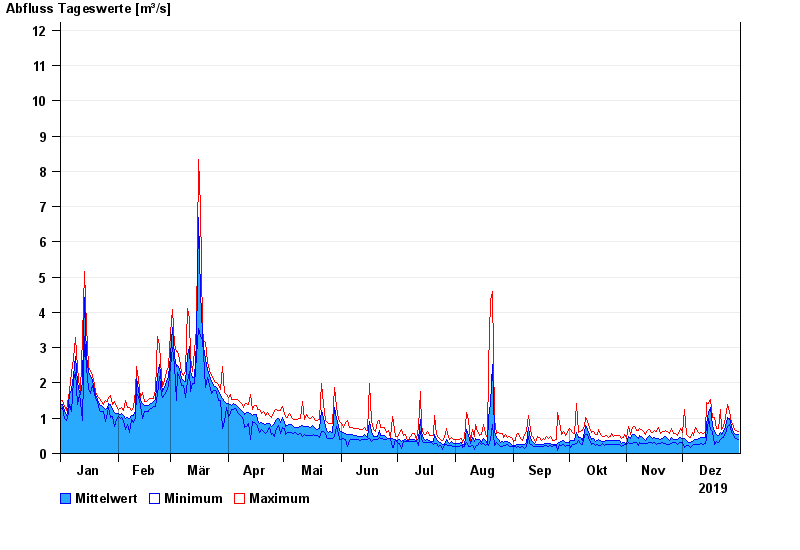
Chart of year Fronhof / Murach
Discharge from 01.01.2019 to 31.12.2019
- 03.06.2013 Abfluss: 31,2 m³/s
- 26.01.1995 Abfluss: 28 m³/s
- 13.02.2005 Abfluss: 23 m³/s
- 14.01.2011 Abfluss: 22,8 m³/s
- 21.12.1993 Abfluss: 22,6 m³/s
| Date | Mean value [m³/s] | Maximum [m³/s] | Minimum [m³/s] |
|---|---|---|---|
| 31.12.2019 | 0.528 | 0.637 | 0.402 |
| 30.12.2019 | 0.536 | 0.665 | 0.422 |
| 29.12.2019 | 0.566 | 0.693 | 0.445 |
| 28.12.2019 | 0.609 | 0.752 | 0.545 |
| 27.12.2019 | 0.757 | 0.885 | 0.6 |
| 26.12.2019 | 0.991 | 1.19 | 0.815 |
| 25.12.2019 | 1.03 | 1.4 | 0.778 |
© Bayerisches Landesamt für Umwelt 2025