
- Start >
- Rivers >
- Discharge >
- Bayern >
- Fürth am Berg >
- Chart of year

Chart of year Fürth am Berg / Steinach
Discharge from 01.01.2020 to 31.12.2020
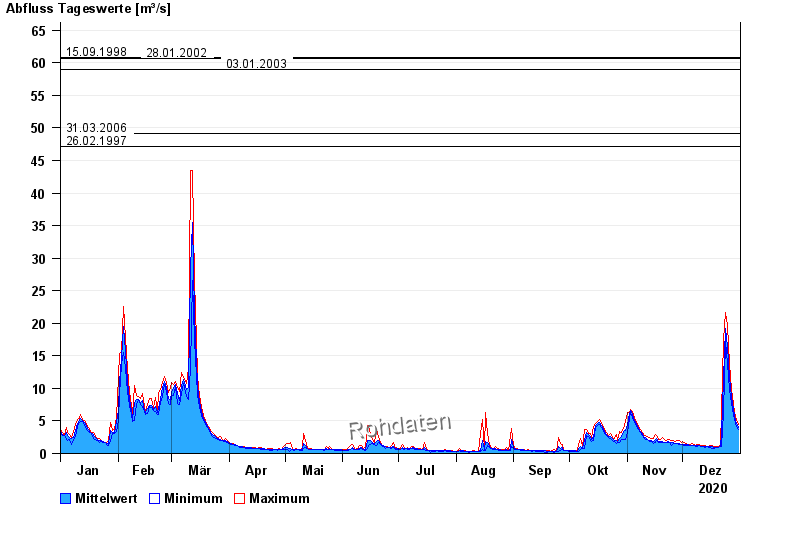
- 15.09.1998 Abfluss: 60,8 m³/s
- 28.01.2002 Abfluss: 60,6 m³/s
- 03.01.2003 Abfluss: 58,9 m³/s
- 31.03.2006 Abfluss: 49,1 m³/s
- 26.02.1997 Abfluss: 47,2 m³/s
| Date | Mean value [m³/s] | Maximum [m³/s] | Minimum [m³/s] |
|---|---|---|---|
| 31.12.2020 | 4.03 | 4.47 | 3.72 |
| 30.12.2020 | 4.68 | 5.17 | 4.18 |
| 29.12.2020 | 5.7 | 6.23 | 5.17 |
| 28.12.2020 | 6.9 | 7.63 | 6.01 |
| 27.12.2020 | 8.62 | 9.87 | 7.63 |
| 26.12.2020 | 11.7 | 13.8 | 9.87 |
| 25.12.2020 | 16.5 | 19.6 | 13.8 |
© Bayerisches Landesamt für Umwelt 2025