
- Start >
- Rivers >
- Discharge >
- Bayern >
- Gampelmühle >
- Chart of year

Chart of year Gampelmühle / Ölschnitz
Discharge from 01.01.2015 to 31.12.2015
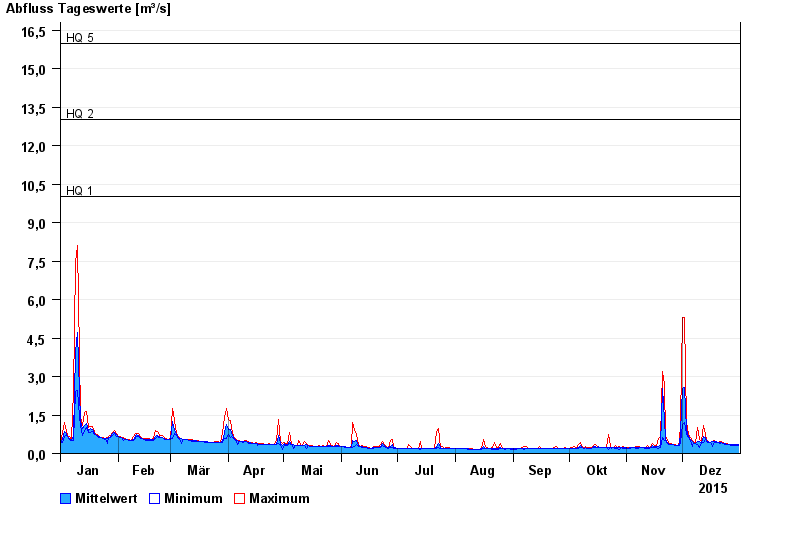
- HQ1 10 m³/s
- HQ2 13 m³/s
- HQ5 16 m³/s
- HQ10 19 m³/s
- HQ20 22 m³/s
- HQ50 26 m³/s
- HQ100 28 m³/s
| Date | Mean value [m³/s] | Maximum [m³/s] | Minimum [m³/s] |
|---|---|---|---|
| 31.12.2015 | 0.332 | 0.352 | 0.313 |
| 30.12.2015 | 0.332 | 0.352 | 0.331 |
| 29.12.2015 | 0.332 | 0.352 | 0.331 |
| 28.12.2015 | 0.332 | 0.351 | 0.331 |
| 27.12.2015 | 0.343 | 0.351 | 0.33 |
| 26.12.2015 | 0.35 | 0.35 | 0.35 |
| 25.12.2015 | 0.367 | 0.371 | 0.35 |
© Bayerisches Landesamt für Umwelt 2025