
- Start >
- Rivers >
- Discharge >
- Bayern >
- Gampelmühle >
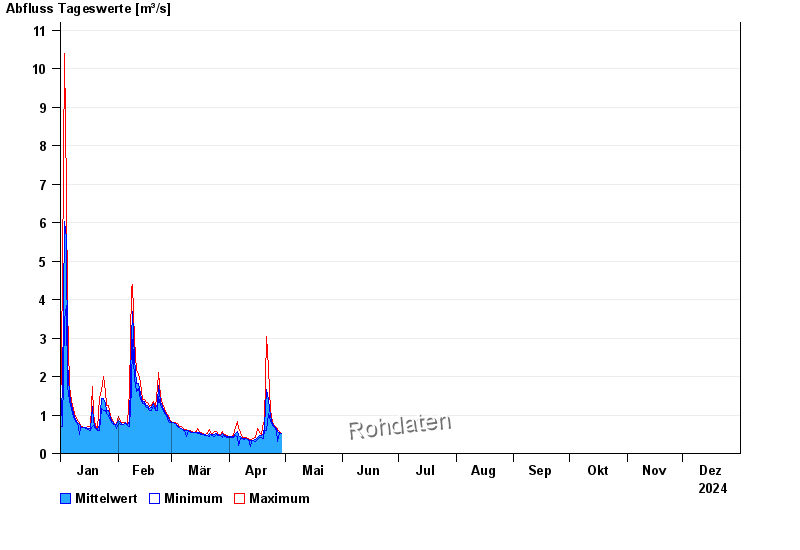
- Chart of year

Chart of year Gampelmühle / Ölschnitz
Discharge from 01.01.2024 to 31.12.2024
| Date | Mean value [m³/s] | Maximum [m³/s] | Minimum [m³/s] |
|---|---|---|---|
| 31.12.2024 | 0.443 | 0.459 | 0.435 |
| 30.12.2024 | 0.456 | 0.459 | 0.435 |
| 29.12.2024 | 0.47 | 0.483 | 0.435 |
| 28.12.2024 | 0.499 | 0.533 | 0.459 |
| 27.12.2024 | 0.537 | 0.584 | 0.508 |
| 26.12.2024 | 0.573 | 0.611 | 0.558 |
| 25.12.2024 | 0.649 | 0.719 | 0.584 |
© Bayerisches Landesamt für Umwelt 2025