
- Start >
- Rivers >
- Discharge >
- Bayern >
- Garmisch o. d. Partnachmündung >
- Chart of year

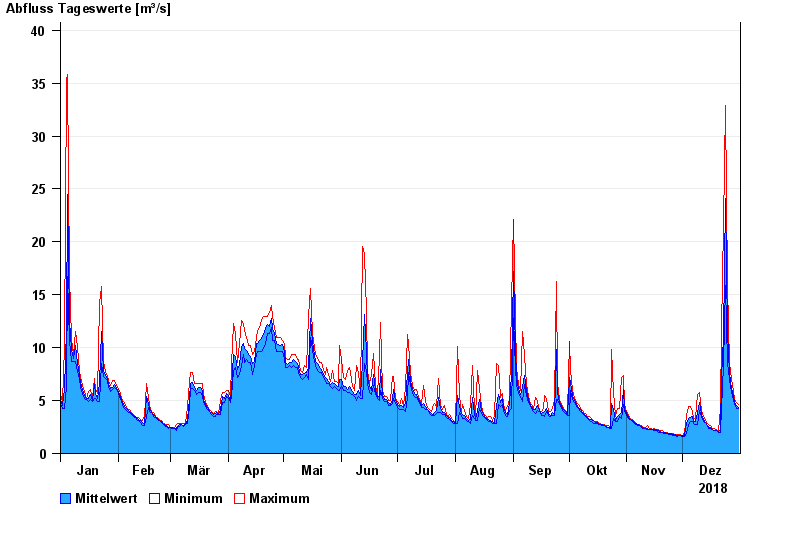
Chart of year Garmisch o. d. Partnachmündung / Loisach
Discharge from 01.01.2018 to 31.12.2018
| Date | Mean value [m³/s] | Maximum [m³/s] | Minimum [m³/s] |
|---|---|---|---|
| 31.12.2018 | 4.38 | 4.61 | 4.27 |
| 30.12.2018 | 4.56 | 4.79 | 4.27 |
| 29.12.2018 | 4.82 | 5.15 | 4.61 |
| 28.12.2018 | 5.44 | 5.92 | 5.15 |
| 27.12.2018 | 6.16 | 6.95 | 5.72 |
| 26.12.2018 | 7.53 | 8.55 | 6.95 |
| 25.12.2018 | 11.4 | 15.9 | 8.55 |
© Bayerisches Landesamt für Umwelt 2025