
- Start >
- Rivers >
- Discharge >
- Bayern >
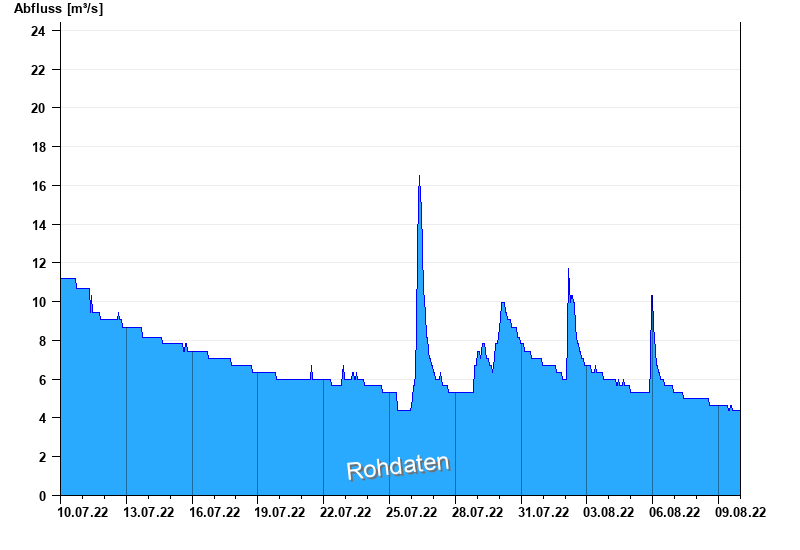
- Garmisch u. d. Partnachmündung >
- Chart of month

Chart of month Garmisch u. d. Partnachmündung / Loisach
Discharge from 10.07.2022 to 09.08.2022
note
Messwerte beeinflusst durch Kraftwerkssteuerung.
- 22.05.1999 Abfluss: 301 m³/s
- 31.05.1940 Abfluss: 245 m³/s
- 23.08.2005 Abfluss: 243 m³/s
- 23.08.1937 Abfluss: 215 m³/s
- 10.08.1970 Abfluss: 204 m³/s
| Date | Runoff [m³/s] |
|---|---|
| 10.08.2022 00:45 | 4.39 |
| 10.08.2022 00:30 | 4.39 |
| 10.08.2022 00:15 | 4.39 |
| 10.08.2022 00:00 | 4.39 |
| 09.08.2022 23:45 | 4.39 |
| 09.08.2022 23:30 | 4.39 |
| 09.08.2022 23:15 | 4.39 |
© Bayerisches Landesamt für Umwelt 2025