

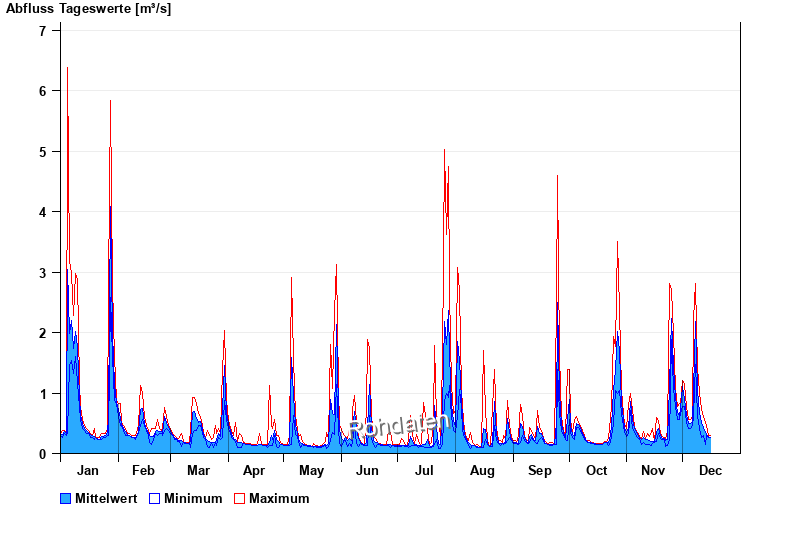
Chart of year Görisried / Waldbach
Discharge from 01.01.2025 to 31.12.2025
| Date | Mean value [m³/s] | Maximum [m³/s] | Minimum [m³/s] |
|---|---|---|---|
| 17.02.2025 | 0.375 | 0.375 | 0.375 |
| 16.02.2025 | 0.395 | 0.461 | 0.375 |
| 15.02.2025 | 0.498 | 0.605 | 0.461 |
| 14.02.2025 | 0.739 | 0.991 | 0.556 |
| 13.02.2025 | 0.73 | 1.12 | 0.461 |
| 12.02.2025 | 0.372 | 0.461 | 0.335 |
| 11.02.2025 | 0.284 | 0.335 | 0.264 |
© Bayerisches Landesamt für Umwelt 2025