
- Start >
- Rivers >
- Discharge >
- Bayern >
- Gollmuthhausen >
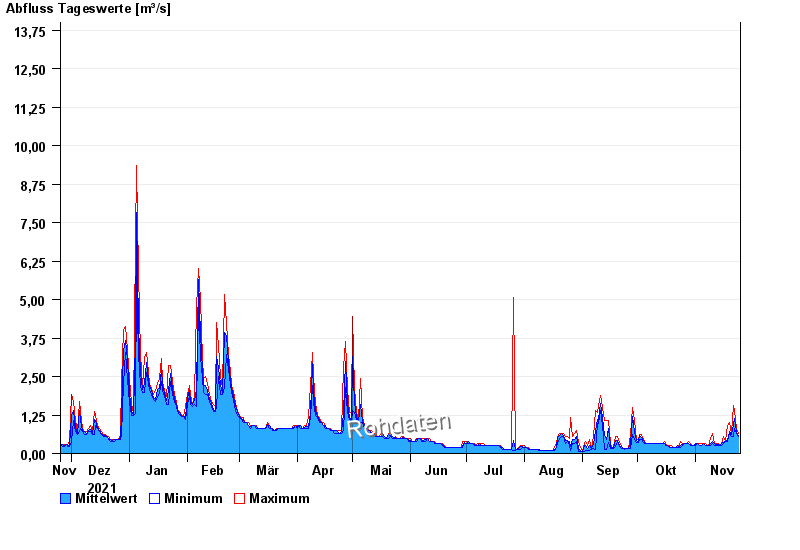
- Chart of year

Chart of year Gollmuthhausen / Milz
Discharge from 25.11.2021 to 24.11.2022
- 03.01.2003 Abfluss: 53,3 m³/s
- 14.01.2011 Abfluss: 40 m³/s
- 23.01.1995 Abfluss: 29,9 m³/s
- 08.01.2011 Abfluss: 28,5 m³/s
- 08.05.2004 Abfluss: 24,8 m³/s
| Date | Mean value [m³/s] | Maximum [m³/s] | Minimum [m³/s] |
|---|---|---|---|
| 24.11.2022 | 0.565 | 0.648 | 0.558 |
| 23.11.2022 | 0.718 | 0.827 | 0.648 |
| 22.11.2022 | 1.14 | 1.4 | 0.827 |
| 21.11.2022 | 0.947 | 1.56 | 0.558 |
| 20.11.2022 | 0.616 | 0.648 | 0.558 |
| 19.11.2022 | 0.709 | 1 | 0.648 |
| 18.11.2022 | 0.434 | 0.915 | 0.391 |
© Bayerisches Landesamt für Umwelt 2025