
- Start >
- Rivers >
- Discharge >
- Bayern >
- Gollmuthhausen >
- Chart of year

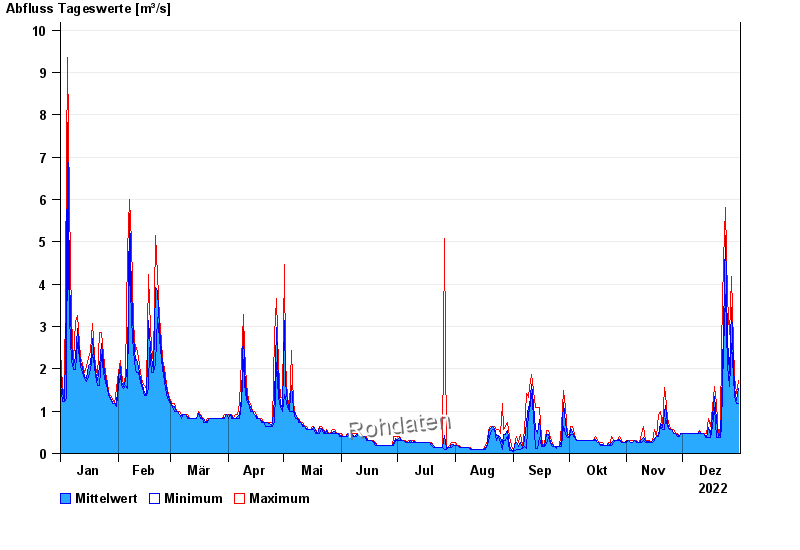
Chart of year Gollmuthhausen / Milz
Discharge from 01.01.2022 to 31.12.2022
| Date | Mean value [m³/s] | Maximum [m³/s] | Minimum [m³/s] |
|---|---|---|---|
| 31.12.2022 | 1.53 | 1.73 | 1.18 |
| 30.12.2022 | 1.25 | 1.42 | 1.18 |
| 29.12.2022 | 1.53 | 1.81 | 1.34 |
| 28.12.2022 | 2.1 | 2.61 | 1.81 |
| 27.12.2022 | 3.45 | 4.19 | 2.61 |
| 26.12.2022 | 1.88 | 2.82 | 1.58 |
| 25.12.2022 | 2.69 | 3.68 | 2.09 |
© Bayerisches Landesamt für Umwelt 2025