
- Start >
- Rivers >
- Discharge >
- Bayern >
- Grafentraubach >
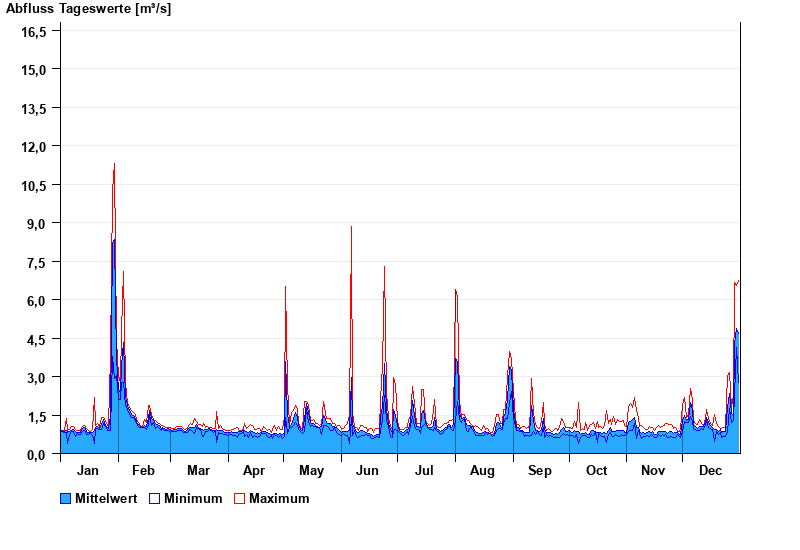
- Chart of year

Chart of year Grafentraubach / Kleine Laber
Discharge from 01.01.2021 to 31.12.2021
Achtung
Daten werden aktuell nur stündlich erfasst und 1x täglich übertragen
- 13.04.1994 Abfluss: 44,8 m³/s
- 14.01.2011 Abfluss: 37,2 m³/s
- 03.03.1987 Abfluss: 36,5 m³/s
- 31.01.1982 Abfluss: 34 m³/s
- 03.06.2013 Abfluss: 30,4 m³/s
| Date | Mean value [m³/s] | Maximum [m³/s] | Minimum [m³/s] |
|---|---|---|---|
| 31.12.2021 | 4.69 | 6.73 | 2.77 |
| 30.12.2021 | 4.89 | 6.56 | 4.13 |
| 29.12.2021 | 4.3 | 6.66 | 2.3 |
| 28.12.2021 | 1.48 | 2.3 | 1.29 |
| 27.12.2021 | 1.54 | 1.78 | 1.19 |
| 26.12.2021 | 2.35 | 3.16 | 1.75 |
| 25.12.2021 | 1.8 | 3.05 | 0.831 |
© Bayerisches Landesamt für Umwelt 2025