

Chart of year Gruben / Oybach
Discharge from 01.01.2024 to 31.12.2024
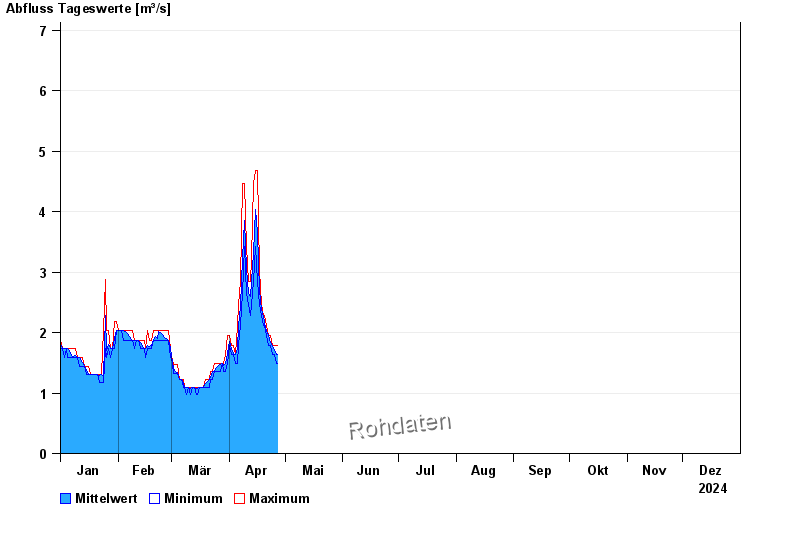
note
Abfluss unsicher wegen Profilveränderung nach Hochwasser.
- 22.05.1999 Abfluss: 75,7 m³/s
- 12.08.2002 Abfluss: 35,6 m³/s
- 16.04.1983 Abfluss: 26,5 m³/s
- 01.08.1970 Abfluss: 22,8 m³/s
- 01.08.1960 Abfluss: 21,1 m³/s
| Date | Mean value [m³/s] | Maximum [m³/s] | Minimum [m³/s] |
|---|---|---|---|
| 31.12.2024 | 0.668 | 0.749 | 0.592 |
| 30.12.2024 | 0.67 | 0.749 | 0.592 |
| 29.12.2024 | 0.663 | 0.749 | 0.592 |
| 28.12.2024 | 0.657 | 0.749 | 0.592 |
| 27.12.2024 | 0.665 | 0.749 | 0.592 |
| 26.12.2024 | 0.66 | 0.749 | 0.592 |
| 25.12.2024 | 0.662 | 0.664 | 0.592 |
© Bayerisches Landesamt für Umwelt 2025