

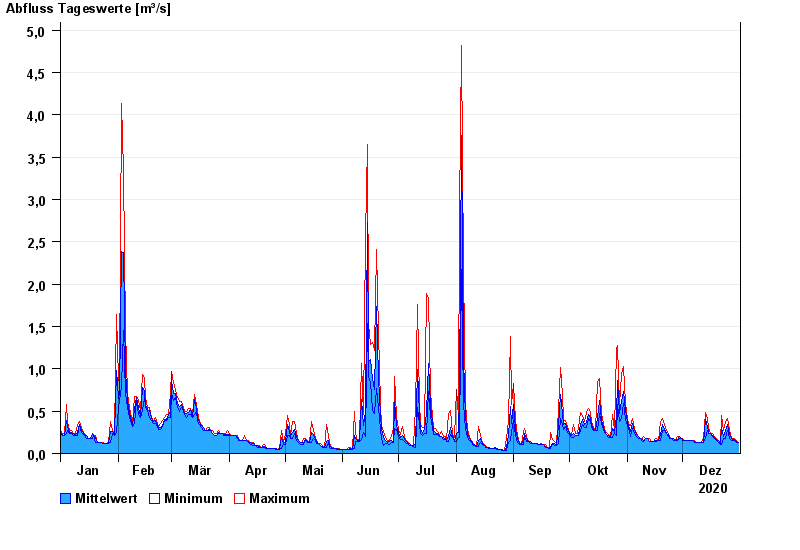
Chart of year Gschwend / Rottach
Discharge from 01.01.2020 to 31.12.2020
| Date | Mean value [m³/s] | Maximum [m³/s] | Minimum [m³/s] |
|---|---|---|---|
| 31.12.2020 | 0.13 | 0.13 | 0.13 |
| 30.12.2020 | 0.144 | 0.153 | 0.13 |
| 29.12.2020 | 0.166 | 0.178 | 0.153 |
| 28.12.2020 | 0.167 | 0.178 | 0.153 |
| 27.12.2020 | 0.175 | 0.178 | 0.153 |
| 26.12.2020 | 0.229 | 0.273 | 0.178 |
| 25.12.2020 | 0.345 | 0.416 | 0.273 |
© Bayerisches Landesamt für Umwelt 2025