
- Start >
- Rivers >
- Discharge >
- Bayern >
- Güntersthal >
- Chart of year

Chart of year Güntersthal / Pegnitz
Discharge from 09.02.2023 to 08.02.2024
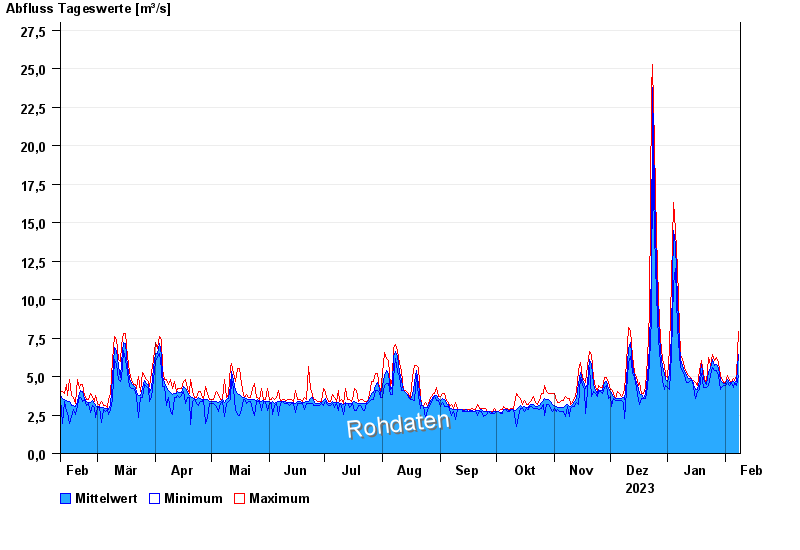
| Date | Mean value [m³/s] | Maximum [m³/s] | Minimum [m³/s] |
|---|---|---|---|
| 08.02.2024 | 6.45 | 7.95 | 5.06 |
| 07.02.2024 | 4.71 | 5.06 | 4.44 |
| 06.02.2024 | 4.6 | 4.75 | 4.59 |
| 05.02.2024 | 4.65 | 4.9 | 4.29 |
| 04.02.2024 | 4.59 | 4.59 | 4.59 |
| 03.02.2024 | 4.62 | 4.75 | 4.44 |
| 02.02.2024 | 4.83 | 5.06 | 4.59 |
© Bayerisches Landesamt für Umwelt 2025